
NEWS RELEASE 31 October 2025
Quarterly Activities Report September 2025
GreenX Metals Limited (ASX:GRX, LSE:GRX, GPW:GRX , Germany-FSE:A3C9JR) (GreenX or the Company) is pleased to present its Quarterly Activities Report for the period during and subsequent to 30 September 2025.
HIGHLIGHTS
· GERMANY - TANNENBERG COPPER PROJECT
· HISTORICAL ESTIMATE:
o The Company announced an historical estimate of 728,000 tonnes contained copper (1,605 Mlbs) at an average grade of 2.6% copper on part of the Tannenb e rg Copper Project (Tannenberg or Project) licence area
§ Estimate based on a 1935-1938 National Socialist Government drilling campaign across four zones: Ronshausen, Hönebach, Wolfsberg and Schnepfenbusch
§ Drilling targeted the thin Kupferschiefer horizon only
§ Focused only on copper and did not include by-product metals
o Independent company St Joe Exploration GmbH conducted limited drilling between 1980 and 1984, further validating the 1940 historical estimate
§ Drilling focused on only 28% of the Ronshausen zone but included by-product silver
§ Drilling identified up to 3.45m thick mineralisation straddling the Kupferschiefer and the limestone hanging wall and sandstone footwall above and below the Kupferschiefer
§ 1984 historical estimate shows consistent grades of 2.1% copper plus 25 g/t silver with 169,000 tonnes of contained copper and 6.5 million ounces of silver
o Exploration upside p otential under m odern i nterpretation : St Joe Exploration confirmed thicker widths of copper and silver mineralisation at Ronshausen, and more may exist up to 30m above and 60m below the Kupferschiefer in the limestone hanging wall and sandstone footwall
§ Hypothesis is consistent with modern understanding of the Kupferschiefer deposit model as demonstrated at KGHM's Polish mining operations which are also found on the same geological structure as the Tannenberg Project.
o GreenX is currently relogging and resampling over 4km of archived core from 47 holes to upgrade historical data to modern standards
§ Investigation of German mining archives and the digitisation of original historical data continues
§ Planning of future twin drilling campaign to verify the historical estimates, and to establish a mineral resource estimate in accordance with the JORC Code (2012) (JORC Code)
o Cautionary statement: The historical estimates in this announcement are not reported in accordance with the JORC Code. A competent person has not done sufficient work to classify the historical estimate as a mineral resource or ore reserve in accordance with the JORC Code. It is uncertain that following evaluation and/or further exploration work that the historical estimate will be able to be reported as a mineral resource or ore reserve in accordance with the JORC Code.
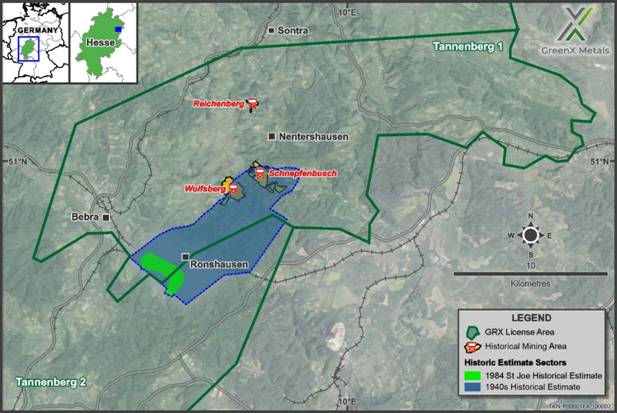
Figure 1: Map showing the location of the zones of the historical estimates and historical mining operations
· HISTORICAL DRILL DATABASE:
o Drilling database comprising 95 drillholes from 1930s exploration discovered in German archives, providing data that represents significant cost and time savings for the ongoing Tannenberg exploration program
o Original detailed geological documentation recovered for 43 drillholes to date, including lithological descriptions, stratigraphic interpretations and other comprehensive data
o Historical assay results located so far for 35 drillholes covering copper, silver, lead, and zinc, with additional sporadic assays for nickel, cobalt, molybdenum, and vanadium
o Archive search program expanded to locate additional drillhole data including German national archives, provincial archives in former East German states and private collections
o Integration of digitised drill logs into GreenX drillhole database and 3D geological models underway to support ongoing exploration activities
· AEROMAG RESULTS IDENTIFY PRIMARY COPPER SOURCE:
o Successful completion of 58km2 airborne magnetic and radiometric survey over the Tannenberg Project, covering the brownfields Richelsdorf copper district, which produced 416,500 tonnes of copper at grades of between 0.8 and 1.2%1 (1800s to 1950s)
o Major geological insight gained with identification of deep metal source structures directly below the historic Richelsdorf mines, following the first modern exploration completed in 40 years
o Mid-European Crystalline Zone (MECZ) identified beneath the mining district - the same geological structure understood to be the primary source of copper in the Kupferschiefer deposits across the European Copperbelt in Germany and Poland
o Large-scale anomalies extend beyond survey area into the Tannenberg 2 licence, significantly increasing exploration potential
ENQUIRIES
| Ben Stoikovich +44 207 478 3900
|
|
|
|
|
TANNENBERG COPPER PROJECT (GERMANY)
Tannenberg is a large scale, relatively shallow and potential high-grade copper brownfields exploration project that is strategically located in the heartland of German industry.
Copper is currently recognised as a strategic raw material by the European Union.
Prior to closure in the 1950's, the Richelsdorf mines produced 416,500 tonnes of copper and 33.7 million ounces of silver from Kupferschiefer type deposits. These historic mines consisted of shallow underground workings originally accessed from surface outcrops.
Kupferschiefer style deposits are a well-known and prolific subtype of sediment-hosted copper deposit that are the second most prevalent source of copper production and reserves in the world and have been historically mined in Germany and are still mined in Poland .
Germany has been a significant mining jurisdiction in the past and continues its mining tradition, including the K+S potash mines which operate 4 km away from the license area and are located in the State of Hesse .
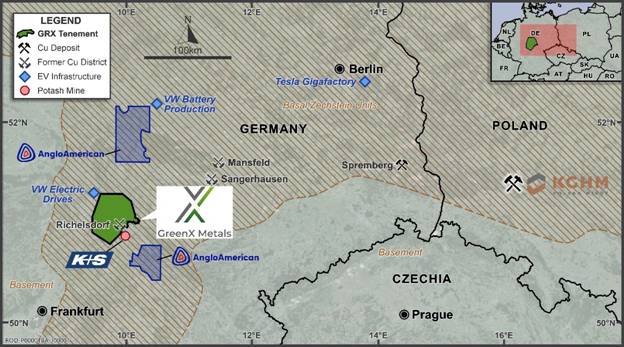
Figure 2 : Tannenberg is located in the industrial centre of Europe within the Basal Zechstein trend
(brown shading)
Historical Estimate
Subsequent to the end of the quarter, the Company that it had identified a historical estimate of 728,000 contained tonnes of copper (1,605 Mlbs) at an average grade of 2.6% copper at Tannenberg from 1940 (1940 historical estimate). The 1940 historical estimate was produced by the German company Mansfeldsche Kupferschieferbergbau AG (Mansfeld AG) and is based on the 95-drill hole exploration campaign carried out during the late 1930s ( refer to further discussion below ) .
In addition, a later historical estimate from 1984 was produced by St Joe Exploration GmbH (St Joe), which covers a small part of the same area as the 1940 historical estimate (St Joe's historical estimate).
The St Joe's historical estimate is based on limited drilling between 1980 and 1984 (refer to announcements dated 2 August 2024 and 28 April 2025). St Joe's historical estimate provides further validation for the 1940s historical estimate.
Cautionary statement : The historical estimates in this announcement are not reported in accordance with the JORC Code. A competent person has not done sufficient work to classify the historical estimate as a mineral resource ore reserve in accordance with the JORC Code. It is uncertain that following evaluation and/or further exploration work that the historical estimate will be able to be reported as a mineral resource ore reserve in accordance with the JORC Code.
1940 Mansfeld Historical Estimate
The 1940 historical estimate was calculated by Mansfeld AG according to the relevant German standards applicable during that time. The 1940 historical estimate is based on 18 holes from the 95-hole database generated during the 1935 to 1938 drilling campaign. The original archive document established 728,000 tonnes of contained copper at an average grade of 2.6% copper between the Wolfsberg and Schnepfenbusch mines in the North and the Ronshausen area in the South (Figure 3). The historical estimate covers mineralisation from a depth of 100m in the North to 400m in the Southern end area near Ronshausen.
The 1940 historical estimate covers only the narrow width Kupferschiefer shale mineralisation, which is notable due to the mistaken belief at the time that copper was only present in the distinctive Kupferschiefer shale. Later exploration campaigns have found mineralisation over much wider thicknesses (see 1984 St Joe's historical estimate section below). This is consistent with GreenX's exploration hypothesis that historical exploration was mainly based on an outdated deposit model that focused on the 20-60 cm-thick Kupferschiefer shale horizon. The modern understanding of the Kupferschiefer deposit model now shows that up to 95% of mineable copper can be hosted in the footwall sandstone and hanging wall limestone, as evidenced at KGHM Polska Miedź S.A's Polish mining operations.
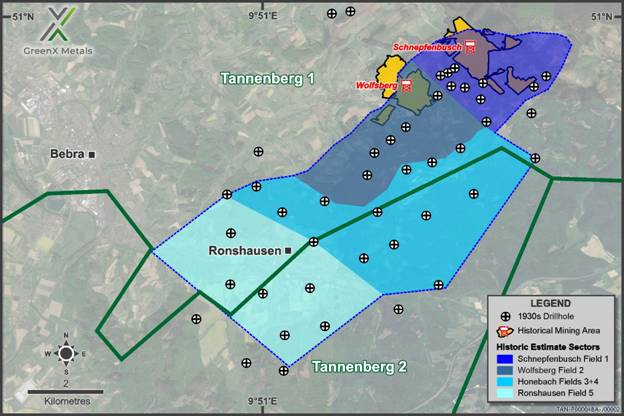
Figure 3 : Map showing the locations of the zones of the 1940 historical estimate, related drill holes and historical mining operations
It is also noteworthy that the 1940 historical estimate did not include by-product silver mineralisation. The majority of the mineralisation (463,000 tonnes of contained copper) was found to be present in the Ronshausen region, with gradually decreasing amounts to the North, where the historical mining is to be found (refer Table 1 below).
| Table 1: Summary of Historical Estimate information from the original 1940 Mansfeld report |
||||
| Zone |
Surface Area |
Thickness (cm) |
Grade Cu |
Contained Copper |
| Ronshausen |
10,000,000 |
67.4 |
2.85 |
463,000 |
| Hönebach |
8,088,000 |
34.2 |
1.92 |
130,055 |
| Wolfsberg |
6,468,000 |
23.5 |
2.35 |
92,945 |
| Schnepfenbusch |
5,528,000 |
19.3 |
2.38 |
65,673 |
| SUB-TOTAL |
|
|
2.59 |
751,673 |
| Less historical production |
|
|
|
(23,793) |
| TOTAL |
|
|
|
727,880 |
Cautionary statement : The historical estimates in this announcement are not reported in accordance with the JORC Code. A competent person has not done sufficient work to classify the historical estimate as a mineral resource ore reserve in accordance with the JORC Code. It is uncertain that following evaluation and/or further exploration work that the historical estimate will be able to be reported as a mineral resource ore reserve in accordance with the JORC Code.
The 1940 historical estimate data provides a good level of transparency with regard to the input data and the calculation methods used. The estimation resulting from the drill hole data was cross-checked by Mansfeld AG against the production grades at the Wolfsberg and Schnepfenbusch mines, which were operating in the area at the time of 1940 historical estimate.
The comparison was favourable, and hence the assays from the exploration holes were used. GreenX has reviewed original records covering 17 of the 18 holes (~95%) used for the historical estimation and found no discrepancies.
Mansfeld AG made specific adjustments as part of the 1940 historical estimate to account for sterilisation. A total of 250,000 tonnes of contained copper was omitted to account for areas where surface features might prevent mining. Mansfeld AG also estimated that a further 23,793 tonnes of contained copper had already been extracted by mining at Wolfsberg and Schnepfenbusch (at a production grade of 2.2% Copper). This amount was then subtracted from the historical estimate, as presented in the original source document (refer Table 1 above).
1984 St Joe's Historical Estimate
Part of the Ronshausen zone of the 1940 historical estimate was drilled by St Joe Exploration during the 1980's, resulting in recognition of the St Joe's historical estimate more than 40 years later. Of the many holes drilled by St Joe, a total of 14 holes were used in the estimate of 169,000 of contained copper and 6.5 million ounces of contained silver. The St Joe's work estimated grades of 2.1 % copper and 25 g/t silver at typical depths between 290 and 370m (Figure 4).
St Joe benefited from both technological advancements and enhanced geological understanding in the 40 years following the work by Mansfeld AG. Consequently, St Joe assayed wider intersections and found that the mineralisation was up to 3.45m width. The historical estimate was calculated using thicknesses of between 1.5 to 2m, considerably thicker than the narrow Kupferschiefer assayed and estimated by Mansfeld AG in 1940.
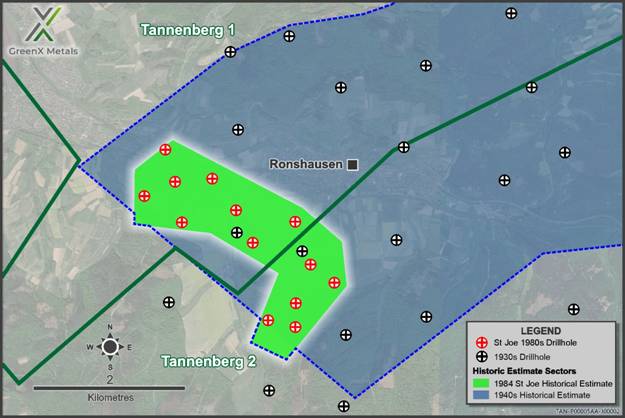
Figure 4 : Map showing the drill holes and locations of the Ronshausen zone of the 1940 historical estimate and the relative location of the 1984 St Joe's historical estimate
Given the increased mineralisation thickness covered by St Joe and the fact that the drilling covered only 28% of the Ronshausen zone, the St Joe's historical estimate further validates the 1940 historical estimate. The identification of much thicker mineralisation and contained silver also points to considerable exploration upside over all five mineralisation zones covered by the 1940 historical estimate.
Cautionary statement : The historical estimates in this announcement are not reported in accordance with the JORC Code. A competent person has not done sufficient work to classify the historical estimate as a mineral resource or ore reserve in accordance with the JORC Code. It is uncertain that following evaluation and/or further exploration work that the historical estimate will be able to be reported as a mineral resource or ore reserve in accordance with the JORC Code.
1930s Drilling Campaign
The 18 holes used in the 1940 historical estimate were drilled between 1935 and 1938 (Figure 5). The southern holes tested the downdip continuation of known Kupferschiefer mining sites from the mid-1800s and led to the opening of the Wolfsberg and Schnepfenbusch mines. In the northern area, the drilling discovered previously unknown down-faulted Kupferschiefer that does not outcrop and had not been previously exploited. This discovery led to the opening of the Reichenberg mine.
GreenX recently found the majority of the relevant original records of these drill holes in a regional archive. To date, of the 95 holes indicated to exist in the 1930s database, the Company has found logs for 43 holes, and of those, original historical assay results have been found for 35 holes. GreenX is continuing the archive search whilst digitising the records to add to the geological database for the Project.
Drilling up to 95 holes today is estimated to cost over €25 million and take several years, given modern permitting requirements. The discovery of the original historical drill database and 1940 historical estimate not only represents a significant saving in both time and money for GreenX, but it also provides valuable data points for its current exploration work program, including exploration targeting and 3D modelling. Combined with the 47 drill cores GreenX is currently re-logging and sampling (Figure 5), the quantity of previous exploration data available at Tannenberg is quickly growing, and underscores Tannenberg as a significant brownfield exploration opportunity.
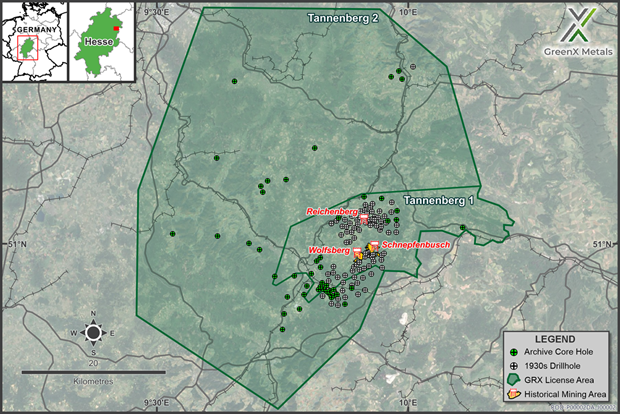
Figure 5 : Location Map of GreenX's Tannenberg project area showing the newly discovered 95 x 1930s drillholes, the location of the three underground copper/ silver mines opened during the late 1930s, and the location of the modern era 47 archive core holes that GreenX now has access to for re-logging and sampling
Airborne Geophysical Survey
The 58km2 airborne survey area was flown using a helicopter-mounted magnetic and radiometric system, covering 660 line-kilometres with high-resolution data collection at 100-metre line spacing at Tannenberg.
The magnetic data shows two large amplitude anomalies, which have been interpreted alongside recent magnetic susceptibility measurements from drill core. The only explanations for the anomalies are deep volcanic rocks within an uplifted basement block deep below the historic mines. Consistent with the magnetic data, the reprocessed residual gravity data shows a Northeast-Southwest striking gravity high which is interpreted as an uplifted basement block. These magnetic and gravity anomalies lead to the conclusion that the MECZ underlies the historic mines.
The MECZ is a belt of very old rocks that runs across central Germany and into Western Poland (Figure 6). These rocks include ancient granites, volcanic rocks, and sediments that were later changed by metamorphism during a mountain-building event called the Variscan orogeny about 300 million years ago. Today, the zone can be seen at surface in areas like the Odenwald (South of Frankfurt), while in other places like the Tannenberg project it is buried under much younger sediments. When a mineral deposit is formed, a source of metals is required through which fluids move to scavenge the copper, these fluids then redeposit the metals higher up within sedimentary rocks.
The consensus in European Kupferschiefer research is that the MECZ of the basement as well as intra-basinal volcanic rocks are the source and as such have contributed the copper and other metals to these mineral deposits (Rentzsch & Franzke 1997, Borg et al. 2012).
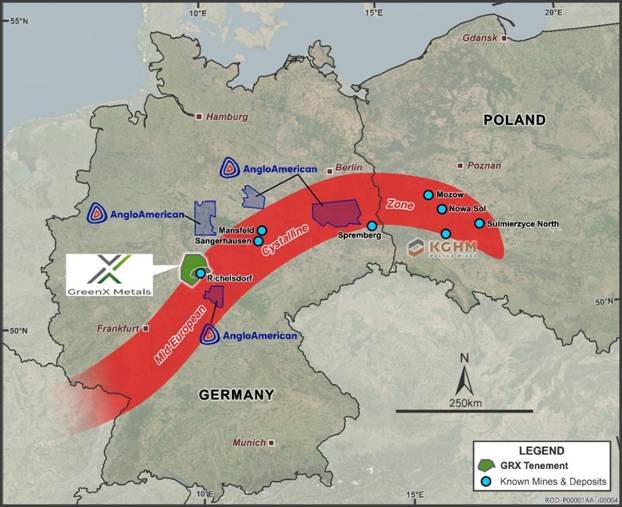
Figure 6 : Extent and location of the wider Mid-European Crystalline Zone (schematic) in Germany and Poland (after Bankwitz 1994) in relation to the locations of key historical and currently operating mines, mineral deposits and tenements
Ongoing Exploration Work Programs at Tannenberg
The discovery of this historical estimate and the National Socialist era drill database is part of the Company's continued search for original historical mining and production data in German archives, which are part of a broader exploration program at Tannenberg, that includes :
· Logging, assaying, and hyperspectral scanning of historical core (ongoing) ;
· Reprocessing and analysis of historical geophysical data (ongoing);
· Collation of historical geological, mine development, and production data (ongoing); and
· Planning of future twin drilling campaign to verify the historical estimates, in order to establish a mineral resource estimate in accordance with the JORC Code.
GREENLAND PROJECTS
Eleonore North Project
GreenX has previously announced that high grade antimony mineralisation had been identified at its Eleonore North project in Greenland (Eleonore North or ELN), based on historical results recently released by the Geological Survey of Denmark and Greenland (GEUS). The historical results indicate the potential for a high-grade antimony-gold mineral system at ELN. Antimony prices have been on a rapid uptrend since China announced antimony export controls from 15 September 2024, with antimony prices in the US now having increased to over US$60,000/t from US$18,300/t .
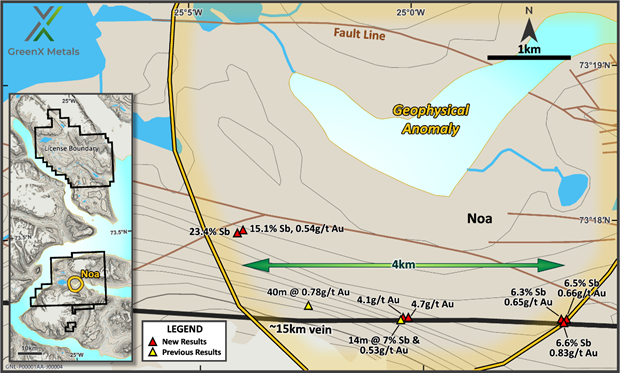
Figure 7 : R eleased GEUS assay results show evidence for high-grade antimony and gold mineralisation above the interpreted Noa Pluton.
Historical data has confirmed the presence of gold and high-grade antimony in outcropping veins at ELN including:
· 14m long chip sample grading 7.2% Sb and 0.53g/t Au
· 40 m chip line with a length weighed average of 0.78g/t Au
Significantly, GEUS geologist's identified stibnite (Sb2S3) as the antimony mineral. Stibnite is well-understood and the predominant ore mineral for commercial antimony production.
Antimony is designated a Critical Raw Material by both the EU and the US, with China being the world's major antimony ore producer and major exporter of refined antimony oxides and metallic antimony.
Global strategic interest in antimony has significantly increased due to several factors:
· China controls ~50% of global antimony mining, most downstream processing and 32% of global resources according to the Lowy Institute.
· China's export ban on antimony, effective from 15 September 2024, has caused market disruption.
· Antimony is a crucial material in the defence supply chain, used in various military applications including ammunition, flame retardants, and smart weaponry.
· Antimony is essential in renewable energy technologies including more-energy-efficient solar panel glass and in preventing thermal runaway in batteries.
· The antimony market is expected to grow by 65% between now and 2032. However, the supply side, declining antimony grades and depleting resources for existing mines are becoming increasingly relevant.
· To aid the Company's exploration targeting and fieldwork planning for ELN, GreenX's technical team intend to locate, analyse, and study further historical samples and data within GEUS's archives.
ANTIMONY RESULTS FROM NEWLY PUBLISHED GEOLOGICAL SURVEY ARCHIVE MATERIAL
GEUS's archives host an extensive collection of rock samples (with and without assays), maps, as well as government and company reports going back many decades. A sub-set of the archive material is available in digital format.
GEUS is continuously digitising and publishing its archive material. The newly released data covers 2008 field work at the Noa Dal valley within the Company's ELN project. Government geologists collected mineralised samples from outcropping veins and scree near to the interpreted Noa Pluton. Selected highlights are presented in Table 2 below.
| Table 2: Selected antimony and gold results from 2008 GEUS fieldwork |
|||
| Sample # |
Sb (%) |
Au (g/t) |
Field description |
| 469506 |
23.40 |
0.00 |
Quartz vein with stibnite. Sample from boulder or scree |
| 496901 |
22.20 |
0.44 |
Massive stibnite from mineralised zone |
| 496918 |
15.10 |
0.54 |
Quartz vein + galena + chalcopyrite |
| 469504 |
6.65 |
0.83 |
Shale with stibnite |
| 496912 |
0.10 |
4.10 |
Clay alteration: hanging wall |
| 496904 |
0.11 |
4.70 |
Clay alteration: footwall |
| 496910 |
0.04 |
2.20 |
Intense clay alteration |
These results conform with previously released historical results from the Noa Dal area (previously reported in ASX announcement dated 10 July 2023).
GEOLOGICAL SIGNIFICANCE OF REDUCED INTRUSION-RELATED GOLD SYSTEMS
GreenX is targeting Reduced Intrusion-related Gold Systems (RIRGS) at ELN. The hypothesised blind-to-the-surface Noa Pluton forms the basis for the RIRGS exploration model. Antimony-gold veins at surface were considered to be supporting evidence for RIRGS at ELN. With the favourable shift in the antimony market, the outcropping veins have become a potentially viable and attractive target.
The antimony-gold mineralisation at ELN could be analogous to Perpetua Resources' Stibnite Gold Project in Idaho, USA. There, RIRGS and orogenic gold mineralisation styles overprint each other. Prior to the RIRGS model at ELN, the gold-bearing veins at Noa Dal were thought to be of orogenic origin. It is relatively common in gold deposits which are proximal to intrusions to feature characteristics of RIRGS and orogenic gold mineralisation styles.
The scale and potential of the antimony-gold veins will be evaluated with a follow-up investigation in the next phase of fieldwork.
GEUS is in the process of releasing results from regional mapping and sampling surveys from field seasons in 2022 and 2023 across East Greenland. GreenX plans to use the soon-to-be-released data as part of ongoing evaluation of the antimony and gold potential at ELN and the region.
Given recent developments in the antimony market, GreenX's exploration strategy at the ELN project in East Greenland will continue with a renewed focus on the known Sb-Au mineral systems at the Noa pluton.
Arctic Rift Copper Project
The Arctic Rift Copper Project (ARC) in Greenland is an exploration joint venture between GreenX and Greenfields Pty Ltd with the Company currently owning a 51% interest in the project. The project is targeting large scale copper in multiple settings across a 5,774 km2 exploration licence in eastern North Greenland. The area has been historically underexplored yet is prospective for copper, forming part of the newly identified Kiffaanngissuseq metallogenic province.
The Company has recently commenced evaluating a number of corporate options for ARC, given the increased prospectivity and focus on the Tannenberg Copper Project.
SUCCESSFUL ARBITRATION OUTCOME IN DISPUTE WITH POLISH GOVERNMENT
In October 2024, GreenX reported a successful outcome of the international arbitration Claim against the Republic of Poland (Respondent) under both the Australia-Poland Bilateral Investment Treaty (BIT) and the Energy Charter Treaty (ECT) (together the Treaties) .
The Company was awarded :
· approximately £252 million (A$ 519 million / PLN 1.2 billion ) in compensation by the Tribunal under the BIT (BIT Award) which includes interest compounded at the Sterling Over-Night Interbank Average ( SONIA ) plus one percentage point (+1%) compounded annually from 31 December 2019 to the date of the award (7 October 2024).
· approximately £183 million (A$ 378 million / PLN 900 million ) in compensation by the Tribunal under the ECT (ECT Award), which includes interest compounded at the SONIA overnight rate +1% compounded annually from 31 December 2019. Interest will continue to accrue at SONIA +1% compounded annually until full and final payment by the Respondent.
· i nterest of approximately £14 million (A$29 million / PLN 68 million) has accrued from when the Award was made in October 2024 to end of September 2025 and will continue to compound annually until full and final payment by the Respondent. Interest expense of only ~£2.7 million (A$5.5 million / PLN 13.1 million) has accrued on the US$11.3 million of litigation funding utilised.
· b oth Awards are subject to any payments made by the Respondent to the Claimant in the other arbitration such that the Claimant is not entitled to double compensation i.e., any amount paid by Respondent in one arbitration (i.e., ECT ) is set off against Respondent's liability in the other arbitration (i.e., BIT ).
· Since the award was made, the Respondent has lodged a request to set-aside the award with the courts of England and Wales in relation to the BIT Award and the courts of Singapore in relation to the ECT Award.
· The Company is strongly defending the set-aside motions with the hearing in Singapore for the ECT Award held during the quarter, however no date has been specified for when a decision will be made
The compensation is denominated in British pound sterling. No hedging is in place for the compensation and accordingly is subject to fluctuations in foreign currency.
Previously, the Polish Prime Minister, Mr Donald Tusk, stated in a press conference that:
"The case is rather hopeless, because a lost arbitration is a lost arbitration. We have two big cases on our shoulders. The PiS government blew this issue.
The Australians, as you know, were promised that their mine would be built there. For years they were misled and later the commitment was withdrawn. It was quite obvious that they would go to arbitration, and it was rather obvious that they would win this arbitration.
Speaking frankly, I would most likely, and I cannot exclude that it will go this way, to find the person directly responsible for Poland now having to pay well over a billion zloty if we do not find a legal solution - which I think has very little probability to set aside the award in this arbitration. So, speaking the truth, I will expect my officers to inform the public in the coming days who made a decision or refrained from making a decision with the consequence of these gigantic losses, that is the compensation that we as the Polish State must pay to the Australians."
Since the Award was made, the Respondent has lodged a request to set-aside the Award with the courts of England and Wales in relation to the BIT Award and the courts of Singapore in relation to the ECT Award. Respondent is challenging jurisdictional aspects of both Awards and alleging procedural unfairness, including in the Tribunal's decision on damages.
The threshold to succeed on a set-aside motion in either the English or Singapore courts is very high, with the courts rejecting set-aside applications in the vast majority of cases.
It is important to note that a "set-aside" motion is different from a general "appeal" since a set-aside motion can in general only relate to a lack of jurisdiction on the part of the Tribunal or procedural unfairness. Under both set-aside motions, the actual merits of the Claim cannot be revisited by the courts.
The Company is strongly defending the set-aside motions with the hearing in Singapore for the ECT Award held during the quarter . Following completion of the hearing, a decision will be made by the court in due course with no specified date available for a decision. The Company will continue to update the market, within the confines of court directed confidentiality requirements, in line with its continuous disclosure requirements.
All of GreenX's costs associated with the initial Claim were funded on a limited basis from Litigation Capital Management (LCM). To date, GreenX has drawn down US$11.3 million from LCM. Once the Award compensation is received from Respondent, LCM will be entitled to be paid back the US$11.3 million, a multiple of five times of the US$11.3 million and, from 1 January 2025, interest on the US$11.3 million at a rate of 30% per annum, compounding monthly (which equates to interest of approximately US$3.6 million (£2.7 million / A$5.5 million / PLN 13.1 million) per annum).
Further information on the Claim and Award can be found in the Company's announcements dated 8 October 2024, 17 October 2024, 11 November 2024 and 22 January 2025.
-ENDS-
Forward Looking Statements
This release may include forward-looking statements. These forward-looking statements are based on GreenX's expectations and beliefs concerning future events. Forward looking statements are necessarily subject to risks, uncertainties and other factors, many of which are outside the control of GreenX, which could cause actual results to differ materially from such statements. GreenX makes no undertaking to subsequently update or revise the forward-looking statements made in this release, to reflect the circumstances or events after the date of that release.
Competent Persons Statement
The information in this report that relates to exploration results were extracted from the ASX announcement s dated 15 July 202 4, 2 August 2024, 27 November 2024, 28 April 2025 and 9 September 2025 which are available to view at www.greenxmetals.com .
GreenX confirms that (a) it is not aware of any new information or data that materially affects the information included in the original announcement; (b) all material assumptions and technical parameters underpinning the content in the relevant announcement continue to apply and have not materially changed; and (c) the form and context in which the Competent Person's findings are presented have not been materially modified from the original announcement s.
The information in this announcement that relates to historical estimates were extracted from the ASX announcement dated 20 October 2025, entitled 'GreenX Uncovers Historical Estimate at Tannenberg Copper Project' (Original Announcement).
GreenX confirms that (a) it is not in possession of any new information or data relating to the historical estimates that materially impacts on the reliability of the estimates or GreenX's ability to verify the historical estimates as mineral resources or ore reserves in accordance with the JORC Code; (b) that the supporting information provided in the Original Announcement referred to in ASX Listing Rule 5.12 continues to apply and has not materially changed; and (c) the form and context in which the Competent Person's findings are presented have not been materially modified from the O riginal A nnouncement .
The information contained within this announcement is deemed by the Company to constitute inside information as stipulated under the Market Abuse Regulations (EU) No. 596/2014 as it forms part of UK domestic law by virtue of the European Union (Withdrawal) Act 2018 ('MAR'). Upon the publication of this announcement via Regulatory Information Service ('RIS'), this inside information is now considered to be in the public domain.
Sources:
1 As reported by the operating company Deutscher Kupferbergbau GmbH (Messer, 1955)
APPENDIX 1: TENEMENT INFORMATION
As at 30 September 2025, the Company has an interest in the following tenements:
| Location |
Tenement |
Percentage |
Status |
Tenement Type |
| Germany |
Tannenberg 1 |
-1 |
Granted |
Exploration Licence |
| Germany |
Tannenberg 2 |
-1 |
Granted |
Exploration Licence |
| Greenland |
Eleonore North gold project |
100 |
Granted |
Exploration Licence |
| Greenland |
Arctic Rift Copper project (Licence No. 2025-168) |
51 |
Granted |
Exploration Licence |
Note:
1 In August 2024, the Company announced that it had entered into an earn-in agreement for Tannenberg through which GreenX can earn a 90% interest in the project. As at the date of this report, the Company held no beneficial interest in Tannenberg, other than through the Tannenberg earn-in agreement. In April 2024, the Tannenberg 1 exploration licence was extended for a further three years which provides GreenX with the ability to exercise its option to acquire 90% of the project, pursuant to the terms of the earn-in agreement.
Appendix 2: Related Party Payments
During the quarter ended 30 September 2025, the Company made payments of A$232,000 to related parties and their associates. These payments relate to existing remuneration arrangements (director fees, consulting fees and superannuation of A$149,000 and the provision of a serviced office and company secretarial and administration services of A$83,000).
Appendix 3: Exploration and Mining Expenditure
During the quarter ended 30 September 2025, the Company made the following payments in relation to exploration activities:
| Activity |
A$000 |
| Germany (Tannenberg) |
|
| Ongoing exploration work programs (re-logging core, reprocessing historical data, etc) |
109 |
| Personnel costs (geology and technical team) |
223 |
| Sub-total |
332 |
|
|
|
| Greenland (Eleonore North and ARC) |
|
| Personnel costs (geology and technical team) |
29 |
| Other (data review, geoimagery, etc) |
12 |
| Sub-total |
41 |
| Total as reported in the Appendix 5B (items 1.2(a) and 2.1(d)) |
373 |
There were no mining or production activities and expenses incurred during the quarter ended 30 September 2025.
Appendix 5B
Mining exploration entity or oil and gas exploration entity
quarterly cash flow report
Name of entity |
||
| GreenX Metals Limited |
||
ABN |
|
Quarter ended ("current quarter") |
| 23 008 677 852 |
|
30 September 2025 |
Consolidated statement of cash flows |
Current quarter |
Year to date |
|
| 1. |
Cash flows from operating activities |
- |
- |
| 1.1 |
Receipts from customers |
||
| 1.2 |
Payments for |
(41) |
(41) |
| |
(a) exploration & evaluation |
||
| |
(b) development |
- |
- |
| |
(c) production |
- |
- |
| |
(d) staff costs |
(405) |
(405) |
| |
(e) administration and corporate costs |
(200) |
(200) |
| 1.3 |
Dividends received (see note 3) |
- |
- |
| 1.4 |
Interest received |
60 |
60 |
| 1.5 |
Interest and other costs of finance paid |
- |
- |
| 1.6 |
Income taxes paid |
- |
- |
| 1.7 |
Government grants and tax incentives |
- |
- |
| 1.8 |
Other (provide details if material) (a) Business Development (b) Arbitration and legal related expenses |
(42) (2,063) |
(42) (2,063) |
| 1.9 |
Net cash from / (used in) operating activities |
(2,691) |
(2,691) |
| |
|||
| 2. |
Cash flows from investing activities |
- |
- |
| 2.1 |
Payments to acquire or for: |
||
| |
(a) Entities |
||
| |
(b) Tenements |
- |
- |
| |
(c) property, plant and equipment |
(13) |
(13) |
| |
(d) exploration & evaluation |
(332) |
(332) |
| |
(e) investments |
- |
- |
| |
(f) other non-current assets |
- |
- |
| 2.2 |
Proceeds from the disposal of: |
- |
- |
| |
(a) entities |
||
| |
(b) tenements |
- |
- |
| |
(c) property, plant and equipment |
- |
- |
| |
(d) investments |
- |
- |
| |
(e) other non-current assets |
- |
- |
| 2.3 |
Cash flows from loans to other entities |
- |
- |
| 2.4 |
Dividends received (see note 3) |
- |
- |
| 2.5 |
Other (provide details if material) |
- |
- |
| 2.6 |
Net cash from / (used in) investing activities |
(345) |
(345) |
| |
|||
| 3. |
Cash flows from financing activities |
- |
- |
| 3.1 |
Proceeds from issues of equity securities (excluding convertible debt securities) |
||
| 3.2 |
Proceeds from issue of convertible debt securities |
- |
- |
| 3.3 |
Proceeds from exercise of options |
- |
- |
| 3.4 |
Transaction costs related to issues of equity securities or convertible debt securities |
(28) |
(28) |
| 3.5 |
Proceeds from borrowings |
- |
- |
| 3.6 |
Repayment of borrowings |
- |
- |
| 3.7 |
Transaction costs related to loans and borrowings |
- |
- |
| 3.8 |
Dividends paid |
- |
- |
| 3.9 |
Other (provide details if material) |
- |
- |
| 3.10 |
Net cash from / (used in) financing activities |
(28) |
(28) |
| |
|||
| 4. |
Net increase / (decrease) in cash and cash equivalents for the period |
|
|
| 4.1 |
Cash and cash equivalents at beginning of period |
6,826 |
6,826 |
| 4.2 |
Net cash from / (used in) operating activities (item 1.9 above) |
(2,691) |
(2,691) |
| 4.3 |
Net cash from / (used in) investing activities (item 2.6 above) |
(345) |
(345) |
| 4.4 |
Net cash from / (used in) financing activities (item 3.10 above) |
(28) |
(28) |
| 4.5 |
Effect of movement in exchange rates on cash held |
(8) |
(8) |
| 4.6 |
Cash and cash equivalents at end of period |
3,754 |
3,754 |
| 5. |
Reconciliation of cash and cash equivalents |
Current quarter |
Previous quarter |
| 5.1 |
Bank balances |
3,754 |
6,826 |
| 5.2 |
Call deposits |
- |
- |
| 5.3 |
Bank overdrafts |
- |
- |
| 5.4 |
Other (provide details) |
- |
- |
| 5.5 |
Cash and cash equivalents at end of quarter (should equal item 4.6 above) |
3,754 |
6,826 |
| 6. |
Payments to related parties of the entity and their associates |
Current quarter |
| 6.1 |
Aggregate amount of payments to related parties and their associates included in item 1 |
(232) |
| 6.2 |
Aggregate amount of payments to related parties and their associates included in item 2 |
- |
| Note: if any amounts are shown in items 6.1 or 6.2, your quarterly activity report must include a description of, and an explanation for, such payments. |
||
| 7. |
Financing facilities |
Total facility amount at quarter end |
|
| 7.1 |
Loan facilities |
18,605* |
16,996 |
| 7.2 |
Credit standby arrangements |
- |
- |
| 7.3 |
Other (please specify) |
- |
- |
| 7.4 |
Total financing facilities |
18,605* |
16,996 |
| |
|
|
|
| 7.5 |
Unused financing facilities available at quarter end |
1,609 |
|
| 7.6 |
Include in the box below a description of each facility above, including the lender, interest rate, maturity date and whether it is secured or unsecured. If any additional financing facilities have been entered into or are proposed to be entered into after quarter end, include a note providing details of those facilities as well. |
||
| On 30 June 2020, the Company executed a Litigation Funding Agreement (LFA) for US$12.3 million (*now worth A$18.6 million with the movement of the A$ compared to the $US) with LCM Funding UK Limited a subsidiary of Litigation Capital Management Limited (LCM), to pursue the damages Claim in relation to the investment dispute between GreenX and Poland). To date, GreenX has drawn down US$11.2 million (A$17.0 million) (Outstanding Funding). In accordance with the terms of the LFA, once the compensation is received, LCM is entitled to be paid the Outstanding Funding, a multiple of five times the Outstanding Funding (based on the period since entering into the LFA) and from 1 January 2025, interest on the Outstanding Funding at a rate of 30% per annum, compounding monthly. |
|||
| 8. |
Estimated cash available for future operating activities |
$A'000 |
| 8.1 |
Net cash from / (used in) operating activities (item 1.9) |
(2,691) |
| 8.2 |
(Payments for exploration & evaluation classified as investing activities) (item 2.1(d)) |
(332) |
| 8.3 |
Total relevant outgoings (item 8.1 + item 8.2) |
(3,023) |
| 8.4 |
Cash and cash equivalents at quarter end (item 4.6) |
3,754 |
| 8.5 |
Unused finance facilities available at quarter end (item 7.5) |
1,609 |
| 8.6 |
Total available funding (item 8.4 + item 8.5) |
5,363 |
| |
|
|
| 8.7 |
Estimated quarters of funding available (item 8.6 divided by item 8.3) |
2
|
| Note: if the entity has reported positive relevant outgoings (ie a net cash inflow) in item 8.3, answer item 8.7 as "N/A". Otherwise, a figure for the estimated quarters of funding available must be included in item 8.7. |
||
| 8.8 |
If item 8.7 is less than 2 quarters, please provide answers to the following questions: |
|
| |
8.8.1 Does the entity expect that it will continue to have the current level of net operating cash flows for the time being and, if not, why not? |
|
| |
No. During the September 2025 quarter, the Company incurred legal costs in relation to the defence of the ECT set-aside proceedings against Poland, which included expenses relating to attending the ECT set-aside hearing held during the quarter. Following completion of the hearing, these legal costs have significantly reduced as the Company awaits a decision, with no date specified for when a decision will be made. |
|
| |
8.8.2 Has the entity taken any steps, or does it propose to take any steps, to raise further cash to fund its operations and, if so, what are those steps and how likely does it believe that they will be successful? |
|
| |
Yes, the Company's continuing operations remain dependent upon raising additional financing, including through equity or other means. The Company routinely assess its options to raise additional funding for the exploration and development of its projects and in relation to the legal costs associated with defending the set-aside motions. |
|
| |
8.8.3 Does the entity expect to be able to continue its operations and to meet its business objectives and, if so, on what basis? |
|
| |
Yes, the Company expects that it will raise additional funding as required for the exploration and development of its projects and to strongly defend the set-aside motions in relation to the favourable arbitration tribunal award received in October 2024. In the meantime, the Company is managing its expenditures to ensure that it can continue its operations and to meet its business objectives. |
|
| |
Note: where item 8.7 is less than 2 quarters, all of questions 8.8.1, 8.8.2 and 8.8.3 above must be answered. |
|
Compliance statement
1 This statement has been prepared in accordance with accounting standards and policies which comply with Listing Rule 19.11A.
2 This statement gives a true and fair view of the matters disclosed.
Date: 31 October 2025
Authorised by: Company Secretary
(Name of body or officer authorising release - see note 4)
Notes
1. This quarterly cash flow report and the accompanying activity report provide a basis for informing the market about the entity's activities for the past quarter, how they have been financed and the effect this has had on its cash position. An entity that wishes to disclose additional information over and above the minimum required under the Listing Rules is encouraged to do so.
2. If this quarterly cash flow report has been prepared in accordance with Australian Accounting Standards, the definitions in, and provisions of, AASB 6: Exploration for and Evaluation of Mineral Resources and AASB 107: Statement of Cash Flows apply to this report. If this quarterly cash flow report has been prepared in accordance with other accounting standards agreed by ASX pursuant to Listing Rule 19.11A, the corresponding equivalent standards apply to this report.
3. Dividends received may be classified either as cash flows from operating activities or cash flows from investing activities, depending on the accounting policy of the entity.
4. If this report has been authorised for release to the market by your board of directors, you can insert here: "By the board". If it has been authorised for release to the market by a committee of your board of directors, you can insert here: "By the [name of board committee - eg Audit and Risk Committee]". If it has been authorised for release to the market by a disclosure committee, you can insert here: "By the Disclosure Committee".
5. If this report has been authorised for release to the market by your board of directors and you wish to hold yourself out as complying with recommendation 4.2 of the ASX Corporate Governance Council's Corporate Governance Principles and Recommendations, the board should have received a declaration from its CEO and CFO that, in their opinion, the financial records of the entity have been properly maintained, that this report complies with the appropriate accounting standards and gives a true and fair view of the cash flows of the entity, and that their opinion has been formed on the basis of a sound system of risk management and internal control which is operating effectively.
RNS may use your IP address to confirm compliance with the terms and conditions, to analyse how you engage with the information contained in this communication, and to share such analysis on an anonymised basis with others as part of our commercial services. For further information about how RNS and the London Stock Exchange use the personal data you provide us, please see our Privacy Policy.