21 February 2023
HSBC Bank plc
Annual Report and Accounts
In fulfilment of its obligations under sections 4.1.3 and 6.3.5(1) of the Disclosure Guidance and Transparency Rules, HSBC Bank plc (the "Company") hereby releases the unedited full text of its 2022 Annual Report and Accounts for the year ended 31 December 2022.
The document is now available on the Company's website:
http://www.hsbc.com/investor-relations/subsidiary-company-reporting
The document has also been submitted to the National Storage Mechanism (NSM) and will shortly be available for inspection at: https://data.fca.org.uk/#/nsm/nationalstoragemechanism
HSBC Bank plc
Annual Report and Accounts 2022
Registered number - 00014259
| Contents |
|
|
|
Page |
| Strategic Report |
|
| Highlights |
3 |
| Key themes of 2022 |
3 |
| Key financial metrics |
5 |
| About HSBC Group |
6 |
| Purpose and strategy |
6 |
| Our Global Businesses |
9 |
| ESG Overview |
10 |
| Key Performance Indicators |
14 |
| Economic background and outlook |
15 |
| Financial summary |
15 |
| Risk overview |
24 |
| Report of the Directors |
|
| Risk |
26 |
| Corporate Governance Report |
101 |
| - Directors |
101 |
| - Company Secretary |
103 |
| - Board of Directors |
104 |
| - Directors' emoluments |
104 |
| - Board committees |
104 |
| - Dividends |
108 |
| - Internal control |
108 |
| - Employees |
111 |
| - Auditors |
112 |
| - Articles of association, conflicts of interest and indemnification of directors |
112 |
| - Statement on going concern |
114 |
| - Statement of directors' responsibilities in respect of the financial statements |
115 |
| Independent Auditors' Report |
116 |
| Financial Statements |
|
| Financial statements |
113 |
| Notes on the financial statements |
124 |
| |
|
| |
|
| Presentation of Information |
|
This document comprises the Annual Report and Accounts 2022 for HSBC Bank plc ('the bank' or 'the company') and its subsidiaries (together 'the group'). 'We', 'us' and 'our' refer to HSBC Bank plc together with its subsidiaries. It contains the Strategic Report, the Report of the Directors, the Statement of Directors' Responsibilities and Financial Statements, together with the Independent Auditors' Report, as required by the UK Companies Act 2006. References to 'HSBC', 'HSBC Group' or 'Group' within this document mean HSBC Holdings plc together with its subsidiaries.
HSBC Bank plc is exempt from publishing information required by The Capital Requirements Country-by-Country Reporting Regulations 2013, as this information is published by its parent, HSBC Holdings plc. This information is available on HSBC's website: www.hsbc.com.
Pillar 3 disclosures for the group are also available on www.hsbc.com, under Investors.
Contents of the linked websites are not incorporated into this document.
All narrative disclosures, tables and graphs within the Strategic Report and Report of the Directors are unaudited unless otherwise stated.
Our reporting currency is £ sterling.
Unless otherwise specified, all $ symbols represent US dollars.
Cautionary Statement Regarding Forward- Looking Statements |
This Annual Report and Accounts 2022 contains certain forward- looking statements with respect to the company's financial condition; results of operations and business, including the strategic priorities; financial, investment and capital targets; and the company's ability to contribute to the Group's Environmental, social and governance ('ESG') targets, commitments and ambitions described herein.
Statements that are not historical facts, including statements about the company's beliefs and expectations, are forward-looking statements. Words such as 'may', 'will', 'should', 'expects', 'targets', 'anticipates', 'intends', 'plans', 'believes', 'seeks', 'estimates', 'potential' and 'reasonably possible', or the negative thereof, other variations thereon or similar expressions are intended to identify forward-looking statements. These statements are based on current plans, information, data, estimates and projections, and therefore undue reliance should not be placed on them. Forward-looking statements speak only as of the date they are made. The company makes no commitment to revise or update any forward-looking statements to reflect events or circumstances occurring or existing after the date of any forward- looking statements. Written and/or oral forward-looking statements may also be made in the periodic reports to the US Securities and Exchange Commission, offering circulars and prospectuses, press releases and other written materials, and in oral statements made by the company's Directors, officers or employees to third parties, including financial analysts. Forward- looking statements involve inherent risks and uncertainties.
Readers are cautioned that a number of factors could cause actual results to differ, in some instances materially, from those anticipated or implied in any forward-looking statement. These include, but are not limited to:
• changes in general economic conditions in the markets in which the company operates, such as new, continuing or deepening recessions, prolonged inflationary pressures and fluctuations in employment and creditworthy customers beyond those factored into consensus forecasts (including, without limitation, as a result of the Russia-Ukraine war and, to a lesser extent, the Covid-19 pandemic); the Russia-Ukraine war and the Covid-19 pandemic and their impact on global economies and the markets where the company operates, which could have a material adverse effect on (among other things) the company's financial condition, results of operations, prospects, liquidity, capital position and credit ratings; deviations from the market and economic assumptions that form the basis for the company's ECL measurements (including, without limitation, as a result of the Russia-Ukraine war, inflationary pressures and the Covid-19 pandemic); changes in foreign exchange rates and interest rates; volatility in equity markets; lack of liquidity in wholesale funding or capital markets, which may affect the company's ability to meet its obligations under financing facilities or to fund new loans, investments and businesses; geopolitical tensions or diplomatic developments, both in Europe and in other regions such as Asia,
• producing social instability or legal uncertainty, such as the Russia-Ukraine war (including the continuation and escalation thereof) and the related imposition of sanctions and trade restrictions, the UK's relationship with the EU, supply chain restrictions and disruptions, sustained increases in energy prices and key commodities and diplomatic tensions between China and the US, extending to the UK and the EU, alongside other potential areas of tension, which may adversely affect the group by creating regulatory, reputational and market risks; the efficacy of government, customer, and the company's and the Group's actions in managing and mitigating ESG risks, in particular climate risk, nature-related risks and human rights risks, and in supporting the global transition to net zero carbon emissions, each of which can impact the company both directly and indirectly through its customers and which may result in potential financial and non-financial impacts; illiquidity and downward price pressure in national real estate markets; adverse changes in central banks' policies with respect to the provision of liquidity support to financial markets; heightened market concerns over sovereign creditworthiness in over-indebted countries; adverse changes in the funding status of public or private defined benefit pensions; societal shifts in customer financing and investment needs, including consumer perception as to the continuing availability of credit; exposure to counterparty risk, including third parties using us as a conduit for illegal activities without the company's knowledge; the discontinuation of certain key Ibors and the development of near risk-free benchmark rates, as well as the transition of legacy Ibor contracts to near risk-free benchmark rates, which exposes the company to material execution risks, including in relation to the effectiveness of the Group's Ibor remediation strategy, and increases some financial and non-financial risks; and price competition in the market segments that the company serves;
• changes in government policy and regulation, including the monetary, interest rate and other policies of central banks and other regulatory authorities in the principal markets in which the company operates and the consequences thereof (including, without limitation, actions taken as a result of the impact of the Russia-Ukraine war on inflation and as a result of the Covid-19 pandemic); initiatives to change the size, scope of activities and interconnectedness of financial institutions in connection with the implementation of stricter regulation of financial institutions in key markets worldwide; revised capital and liquidity benchmarks, which could serve to deleverage bank balance sheets and lower returns available from the current business model and portfolio mix; changes to tax laws and tax rates applicable to the company, including the imposition of levies or taxes designed to change business mix and risk appetite; the practices, pricing or responsibilities of financial institutions serving their consumer markets; expropriation, nationalisation, confiscation of assets and changes in legislation relating to foreign ownership; the UK's relationship with the EU, which continues to be characterised by uncertainty and political disagreement, particularly with respect to the regulation of financial services, despite the signing of the Trade and Cooperation Agreement ('TCA') between the UK and the EU; changes in UK macro-economic and fiscal policy as a result of the change in UK government leadership, which may result in fluctuations in the value of the pound sterling; general changes in government policy that may significantly influence investor decisions; the costs, effects and outcomes of regulatory reviews, actions or litigation, including any additional compliance requirements; and the effects of competition in the markets where we operate, including increased competition from non-bank financial services companies; and
• factors specific to the company and the Group, including the company's success in adequately identifying the risks it faces, such as the incidence of loan losses or delinquency, and managing those risks (through account management, hedging and other techniques); the company's ability to achieve its financial, investment, capital targets and the achievement of the Group's ESG targets, commitments and ambitions, which may result in the company's failure to achieve any of the expected benefits of its strategic priorities; model limitations or
failure, including, without limitation, the impact that high inflationary pressures, rising interest rates and the consequences of the Covid-19 pandemic have had on the performance and usage of financial models, which may require the company to hold additional capital, incur losses and/or use compensating controls, such as judgemental post-model adjustments, to address model limitations; changes to the judgements, estimates and assumptions the company bases its financial statements on; changes in the company's ability to meet the requirements of regulatory stress tests; a reduction in the credit ratings assigned to the company or any of its subsidiaries, which could increase the cost or decrease the availability of the company's funding and affect its liquidity position and net interest margin; changes to the reliability and security of the company's data management, data privacy, information and technology infrastructure, including threats from cyber-attacks, which may impact its ability to service clients and may result in financial loss, business disruption and/ or loss of customer services and data; the accuracy and effective use of data, including internal management information that may not have been independently verified; changes in insurance customer behaviour and insurance claim rates; the company's dependence on loan payments and dividends from subsidiaries to meet its obligations; changes in accounting standards, including the implementation of IFRS 17 'Insurance Contracts', which may have a material impact on the way the company prepares its financial statements and (with respect to IFRS 17) may negatively affect the profitability of HSBC's insurance business; changes in the company's ability to manage third-party, fraud and reputational risks inherent in its operations; employee misconduct, which may result in regulatory sanctions and/or reputational or financial harm; changes in skill requirements, ways of working and talent shortages, which may affect the company's ability to recruit and retain senior management and diverse and skilled personnel; and changes in the company's ability to develop sustainable finance and climate-related products consistent with the evolving expectations of its regulators, and the company's capacity to measure the climate impact from its financing activity (including as a result of data limitations and changes in methodologies), which may affect the Group's ability to achieve its climate ambition, targets and commitments, and increase the risk of greenwashing. Effective risk management depends on, among other things, the company's ability through stress testing and other techniques to prepare for events that cannot be captured by the statistical models it uses; the company's success in addressing operational, legal and regulatory, and litigation challenges; and other risks and uncertainties we identify in 'Top and emerging risks' on page 28 of the Annual Report and Accounts 2022.
s
| Highlights |
For the year ended 31 December 2022
| Reported (loss)/profit before tax (£m) |
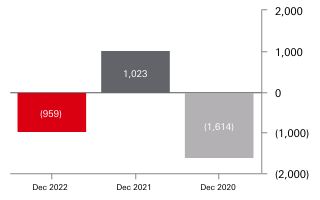 £(959)m
(2021: £1,023m); (2020: £(1,614)m)
| Reported revenue (£m)
|
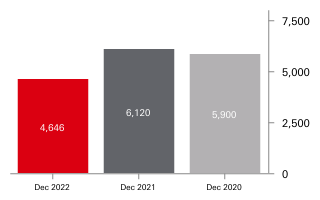 £4,646m
(2021: £6,120m); (2020: £5,900m)
| Reported risk-weighted assets at period end (£bn) |
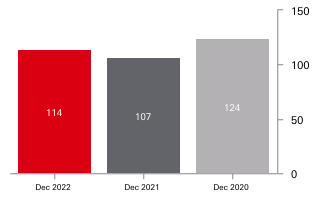 £114bn
(2021: £107bn); (2020: £124bn)
.
| Adjusted profit/(loss) before tax (£m) |
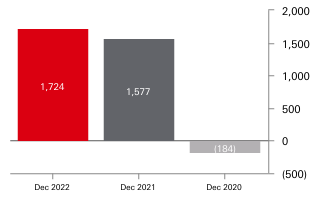 £1,724m
(2021: £1,577m); (2020: £(184)m)
| Total assets at period end (£bn) |
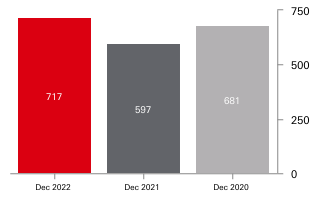 £717bn
(2021: £597bn); (2020: £681bn)
| Common equity tier 1 ratio at period end (%) |
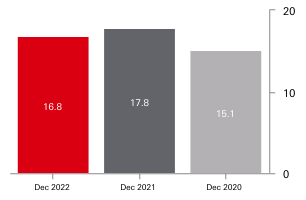 16.8%
16.8%
(2021: 17.8%); (2020: 15.1%)
| Key themes of 2022 |
HSBC Bank plc continued to support the Group through progress on our strategic aims, although challenges in the geopolitical and economic environment remain.
| Financial Performance |
Our financial performance in 2022 reflected losses associated with our restructuring initiatives, including impairments of businesses which have been classified as held-for-sale. These items resulted in a reported loss before tax. On an adjusted basis, profit before tax increased due to the benefit of higher interest rates and a strong performance in MSS. Costs decreased driven by the impact of our transformation and cost-saving initiatives. Expected credit losses returned to a charge for the year compared with a net release in 2021. Read more on pages 16 to 22.
| Strategic Transformation |
We have continued to progress in our areas of strength and simplify the group in order to streamline our operating model and seek to improve returns. During the course of 2022, we continued to prepare for the completion of the sale of our French retail operations, announced the sale of our Greece branch operations and entered into a sale agreement for our Russia business.
We remain focused on implementing our Intermediate Parent Undertaking ('IPU'), in line with European Union ('EU') Capital Requirements Directive ('CRD'): HSBC Continental Europe ('HBCE') acquired HSBC Trinkaus & Burkhardt GmbH ('HSBC Germany') and HSBC Bank Malta ('HBMT'), and expect to acquire HSBC Private Bank (Luxembourg) SA in the first half of 2023, subject to receipt of pending regulatory approvals. More information can be found on pages 6 and 7.
Climate Ambition |
The Group is committed to a net zero future and recognises that our planet urgently needs drastic and lasting action to protect our communities, businesses and the natural environment from the damaging effects of climate change.
The Group believe they can make the most significant impact by working with its customers to support their transition to a net zero global economy. Since 2020, HSBC Bank plc has supported our customers' transition to net zero and helped build a sustainable future by providing and facilitating $86.2bn of sustainable finance, $18.9bn of sustainable investment and $0.1bn of sustainable infrastructure, as defined in the Group's Sustainable Finance Data Dictionary 2022. This financing and investment contributes towards the Group's ambition to provide and facilitate $750bn to $1tn of sustainable financing and investment by 2030. The $86.2bn of sustainable finance includes lending facilities provided and capital markets facilitated transactions.
1 The detailed definitions of the contributing activities for sustainable finance are available in the Group's revised Sustainable Finance Data Dictionary 2022. For the Group's ESG Data Pack, Sustainable Finance Data Dictionary and third-party limited assurance report, see www.hsbc.com/who-we-are/esg-and-responsible-business/esg-reportingcentre
| Key financial metrics |
|
|
2022 |
2021 |
2020 |
| For the year (£m) |
|
|
|
| (Loss)/profit before tax (reported basis) |
(959) |
1,023 |
(1,614) |
| Profit/(loss) before tax (adjusted basis)1 |
1,724 |
1,577 |
(184) |
| Net operating income before change in expected credit losses and other credit impairment charges (reported basis)2 |
4,646 |
6,120 |
5,900 |
| (Loss)/profit attributable to the parent company |
(408) |
1,041 |
(1,488) |
| At 31 December (£m) |
|
|
|
| Total equity attributable to shareholders of the parent company |
23,875 |
23,584 |
23,666 |
| Total assets |
717,353 |
596,611 |
681,150 |
| Risk-weighted assets3,8 |
114,171 |
106,703 |
124,353 |
| Loans and advances to customers (net of impairment allowances) |
72,614 |
91,177 |
101,491 |
| Customer accounts |
215,948 |
205,241 |
195,184 |
| Capital ratios (%)3,8 |
|
|
|
| Common equity tier 1 |
16.8 |
17.8 |
15.1 |
| Tier 1 |
20.2 |
21.4 |
18.5 |
| Total capital |
31.7 |
31.9 |
27.5 |
| Leverage ratio (%)4,8 |
5.5 |
4.2 |
4.0 |
| Performance, efficiency and other ratios (annualised %) |
|
|
|
| Return on average ordinary shareholders' equity5 |
(3.1) |
4.3 |
(7.9) |
| Return on tangible equity (%)6 |
5.5 |
6.1 |
(2.7) |
| Cost efficiency ratio (reported basis)7 |
115.2 |
89.2 |
113.6 |
| Cost efficiency ratio (adjusted basis)7 |
70.9 |
80.9 |
89.6 |
| Ratio of customer advances to customer accounts |
33.6 |
44.4 |
52.0 |
1 Adjusted performance is computed by adjusting reported results for the effect of significant items as detailed on pages 18 to 20.
2 Net operating income before change in expected credit losses and other credit impairment charges is also referred to as revenue.
3 Unless otherwise stated, regulatory capital ratios and requirements are based on the transitional arrangements of the Capital Requirements Regulation in force at the time. These include the regulatory transitional arrangements for IFRS 9 'Financial Instruments', which are explained further on page 80. References to EU regulations and directives (including technical standards) should, as applicable, be read as references to the UK's version of such regulation and/or directive, as onshored into UK law under the European Union (Withdrawal) Act 2018, and as may be subsequently amended under UK law.
4 The leverage ratio is calculated using the end point definition of capital and the IFRS 9 regulatory transitional arrangements, in line with the UK leverage rules that were implemented on 1 January 2022, and excludes central bank claims and cash pooling netting. Comparatives for 2021 are reported based on the disclosure rules in force at that time, and include claims on central banks.
5 The return on average ordinary shareholders' equity is defined as profit attributable to shareholders of the parent company divided by the average total shareholders' equity.
6 The RoTE is calculated by adjusting reported profit attributable to ordinary shareholders by excluding movements in PVIF and significant items (net of tax), divided by average tangible shareholders' equity excluding fair value of own debt, debit valuation adjustment ('DVA') and other adjustments for the period. The calculation of this measure includes the UK bank levy incurred for the first time in 2021, which was previously paid by the Group. Comparative data have not been re-presented.
7 Reported cost efficiency ratio is defined as total operating expenses (reported) divided by net operating income before change in expected credit losses and other credit impairment charges (reported), while adjusted cost efficiency ratio is defined as total operating expenses (adjusted) divided by net operating income before change in expected credit losses and other credit impairment charges (adjusted).
8 From 30 September 2022, investments in non-financial institution subsidiaries or participations have been measured on an equity accounting basis in compliance with UK regulatory requirements. Comparatives for prior periods have been represented on a consistent basis with the current year.
| About HSBC Group |
With assets of $3.0tn and operations in 62 countries and territories at 31 December 2022, HSBC is one of the largest banking and financial services organisations in the world. Approximately 39 million customers bank with the Group and the Group employs around 219,000 full-time equivalent staff. The Group has around 182,000 shareholders in 128 countries and territories.
| Purpose and strategy |
| HSBC's purpose and ambition |
The Group's purpose is 'Opening up a world of opportunity' and the Group's ambition is to be the preferred international financial partner for the Group's clients.
HSBC values
HSBC values help define who we are as an organisation and are key to our long-term success.
We value difference
Seeking out different perspectives.
We succeed together
Collaborating across boundaries.
We take responsibility
Holding ourselves accountable and taking the long view.
We get it done
Moving at pace and making things happen.
HSBC Group strategy
The Group is implementing its strategy at pace across the four strategic pillars aligned to its purpose, values and ambition announced in February 2021.
The Group's strategy centres on four key pillars: focus on our areas of strength, digitise at scale to adapt our operating model for the future; energise our organisation for growth and support the transition to a net zero global economy.
Focus on our strengths: in each of our global businesses, the Group will focus on areas where we are strongest and have opportunities to grow.
Digitise at scale: the Group will focus investments in areas such as technology, to improve our customers' experience while ensuring security and resilience. These investments in technology will also help drive down costs, including through automating our middle and back offices and building solutions to free up office footprint.
Energise for growth: the Group is moving to a leaner and simpler organisation that is energised and fit for the future. The Group aims to inspire a dynamic culture and champion inclusion across the organisation, as well as help employees develop future skills.
Transition to net zero: the Group's ambition is to support the transition to a net zero global economy. The Group has set out an ambitious plan to aim to become a net zero bank, to support customers in their transition, and to unlock new climate solutions.
HSBC in Europe
Europe is an important part of the global economy, accounting for roughly 40% of global trade and one-quarter of global Gross Domestic Product (UNCTAD, IMF 2021). In addition, Europe is the world's top exporter of services and second largest exporter of manufactured goods (UNCTAD, IMF 2021). HSBC Bank plc facilitates trade within Europe and between Europe and other jurisdictions where the HSBC Group has a presence.
With assets of £717bn at 31 December 2022, HSBC Bank plc is one of Europe's largest banking and financial services organisations. We employ around 14,400 people across our locations. HSBC Bank plc is responsible for HSBC's European business, apart from UK retail and most UK commercial banking activity which, post ring-fencing, are managed by HSBC UK Bank plc.
HSBC Bank plc operates as one integrated business with two main hubs in London and Paris.
HSBC Bank plc is present in 20 markets1. We are organised around the principal operating units detailed below, which represent the region to customers, regulators, employees and other stakeholders.
The London hub consists of the UK non-ring fenced bank, which provides overall governance and management for the Europe region as a whole and is a global centre of excellence for wholesale banking for the Group.
HBCE comprises our Paris hub, its EU branches (Belgium, Czech Republic, Greece, Ireland, Italy, Luxembourg, Netherlands, Poland, Spain and Sweden), Germany and Malta. We are creating an integrated Continental European bank anchored on Paris to better serve our clients and simplify our organisation.
1 Full list of markets where HSBC Bank plc has a presence: Armenia, Belgium, Channel Islands and Isle of Man, Czech Republic, France, Germany, Greece, Ireland, Italy, Israel, Luxembourg, Malta, Netherlands, Poland, Russia, South Africa, Spain, Sweden, Switzerland and the UK.
| HSBC Bank plc's strategy and progress on our 2022 commitments |
Our ambition in Europe is to be the leading international wholesale bank connecting East and West, with a complementary Wealth business, an efficient operating model and a robust control framework (see our global businesses on page 9).
HSBC Bank plc exists to open up a world of opportunity for our customers by connecting them to international markets. Europe is the largest trading region in the world and Asia is Europe's biggest and fastest growing external trading partner (UNCTAD, IMF 2021). We are well positioned to capitalise on this opportunity and play a pivotal role for the Group.
We expect Europe to continue to deliver change in 2023 to drive our ambition, the majority of announced transformation has been completed (see 'Focus on our strengths' for more information). In parallel to completing our transformation work, we are repositioning for growth and are well placed to seek to deliver strong financial performance. Further detail can be found below.
In 2022, Europe faced significant inflationary pressure, resulting in rapid central bank interest rate rises. We expect to continue operating in a volatile environment. Further information as to how we have and will continue to support and engage with our stakeholders can be found on page 10.
Below we provide a progress update on our commitments and strategic initiatives for 2022.
Focus on our strengths
Through our transformation programme we are building a leaner, simpler bank with a sharper strategic focus. We have redesigned our franchise around the needs of our international clients and maintaining product and service capability where clients demand them. We intend to be a market leader in sustainable financing and assist the Group in meeting its climate ambition for net zero operations and supply chain by 2030.
New regulation in the EU provides an opportunity to simplify our structure. In response to the requirement for an IPU in line with EU CRD V, HBCE acquired HSBC Germany and HBMT in the second half of 2022, and expects to acquire HSBC Private Bank (Luxembourg) SA in the first half of 2023. This remains subject to regulatory approvals for which the process has now started.
During 2022, HBCE has continued to prepare for the completion of the sale, of our French retail business which is expected in the second half of 2023, subject to regulatory approval. Until completion
of the planned transaction, the business remains part of, and will be managed by HBCE. Please see Note 34: Assets held for sale and liabilities of disposal groups held for sale, for further financial information on the transaction on page 186.
Following a strategic review of our business in Greece, an agreement has been signed to sell HBCE's branch operations in Greece to Pancreta Bank SA. The transaction is subject to regulatory approval and is expected to complete in the first half of 2023.
Following a strategic review of HSBC Europe BV (a wholly-owned subsidiary of HSBC Bank plc), we have stopped taking on new business and clients in our Russian operations. The value of foreign currency customer deposits and RUB deposits is now minimal. HSBC Europe BV has entered into an agreement to sell its wholly-owned subsidiary HSBC Bank (RR) (Limited Liability Company), subject to regulatory and governmental approvals. Such sale is currently expected to occur in the first half of 2023.
HSBC Group has implemented a new operating model for its Private Banking activities, in which HSBC Private Bank (Luxembourg) SA will become a central hub for HBCE's Private Banking clients. These clients will be served via a Paris branch of HSBC Private Bank (Luxembourg) SA. This will enable us to provide an enhanced product range to clients leveraging our infrastructure in Luxembourg.
Digitise at scale
We continue to invest in the digitisation of our global businesses, which is central to our strategy. Within Europe, Wealth and Personal Banking ('WPB') is focused on enhancing our engagement between clients and relationship managers, and allowing clients to self-serve at a time that suits them. For example, we further enhanced our digital portfolio and risk analysis platform, which furthered Private Bank advisers' ability to make suitable investment recommendations to clients using a more holistic approach to risk management. For our Retail customers, we have placed efforts into reducing paper waste in connection with the bank statements, with 33,000 bank statements viewed or downloaded in the Channel Islands. Looking ahead, we will seek to deploy secure and private communications via social media channels between clients and relationship managers. We also plan to introduce new ESG-centred reporting.
We are committed to maintaining our core strength in Global Payments Solutions ('GPS'), formerly known as Global Liquidity and Cash Management ('GLCM'). In 2022, we successfully delivered Real Time Payment capability in Luxembourg. GPS have improved our offering for customers in HSBCnet by enabling new features such as allowing customers to track and create recurring SEPA payments. GPS also enhanced the Liquidity Management Dashboard functionality, improving customers' ability to create and manage cash flow forecasts. By December 2022, we had 288 customers using the dashboard.
Our strategy within Global Trade and Receivables Finance ('GTRF') Europe is to help make trade easier, faster and safer, whilst seeking to deliver sustainable and profitable growth. Throughout 2022, we enhanced our digital channel HSBCnet and strengthened collaborations with third-party platforms. Examples of third-party collaboration include Komgo, a bank-agnostic platform that provides solutions to our customers to manage trade finance needs, and Contour, a blockchain solution that fully digitises letters of credit.
As at year end, 85% of trade transactions across Europe were conducted digitally as we continue to see an increase in clients adopting digital solutions.
For digital currencies and assets, we have made significant progress in 2022 in building a strategic tokenisation platform ('HSBC Orion') in Global Banking and Markets. HSBC Orion launched the world's first GBP tokenised bond in January 2023.
The platform allows natively digital bonds to be registered and issued, fully supports both primary and secondary market trading and is part of our ambition to widen the adoption of digital assets.
In Foreign Exchange we continue to enhance our electronic trading infrastructure to provide improved risk management to our clients. Our focus is to support customers' FX and cross-border payment needs through improved pricing tools and e-trading.
Energise for growth
Empowering our organisation and energising our employees is critical to Europe's success and remains a key focus. We made good progress against our people strategy including our diversity and inclusion agenda and are committed to offering colleagues the opportunities to develop their skills whilst building our talent pipelines to support the achievement of our strategic priorities.
We are committed to increasing diverse representation in Europe, especially at senior levels and in 2023 we aim to significantly increase sponsorship and accountability for achieving our goals. Our Diversity and Inclusion Council defines and drives specific actions across our D&I strands, supported by our pan-European Employee Resource Group 'Inclusive Europe'.
To support the Group's climate ambitions to become net zero in its operations and supply chain by 2030, and align its financed emissions to the Paris Agreement goal of net zero by 2050, the Group launched the Sustainability Academy in 2022. The Academy is available to all colleagues across the Group and serves as a central point for colleagues to access learning plans and curated resources, and develop practical skills. The Group have partnered with some leading educational institutions such as Imperial College Business School and will continue to update the academy with new research and content related to ESG issues, including those related to social and governance issues.
We have strengthened the training we provide to leaders to help them support colleagues through the changing environment we are facing. We have continued the executive development programme for our most senior leaders, which focuses on the shifting expectations of our enterprise wide leadership cadre, embedding the clarity and alignment to achieve our goals and tackling strategic change.
For our Managing Director population, we have taken into consideration that leadership development will vary depending on individual career experiences and tenure in role. Our executive curriculum contains an array of programmes to meet varying leadership development personas and topics focus on a range of issues including critical skills areas such as influence, inclusion, and Agile methodologies. During 2022, we launched two Managing Director development programmes: 1) Shaping your Leadership; to help new Managing Directors sharpen their focus and define how they will 'show-up' as one of HSBC's most senior leaders, 2) Shaping HSBC, which focuses on the experimentation required to enhance the leadership skills that will drive adaptability, innovation and unleash the talent of our people to enable HSBC to thrive in a time of disruption and complexity.
We continue to focus on the development of people managers who are key to shaping the experience of, and development of, our colleagues. We have recently refreshed our core People Manager Excellence curriculum which covers 40 skills structured around four modules that are available in face-to-face and virtual formats. The modules focus on: 1) Your Role; connecting managers with HSBCs purpose and personal energetic leadership, 2) Your People; creating energy, commitment and high performance within your team, 3) Your work; managing productivity and delivering against outcomes, and 4) Your Team; building high performing collaborative teams.
Complimentary digital learning pathways will also be made available to support the development contained within the four modules.
Transition to net zero
Part of the Group's ambition to be a net zero bank is to achieve net zero carbon emissions in our operations and supply chain by 2030.
The Group has three elements to the strategy: reduce, replace and remove. The Group plan to first focus on reducing carbon emissions from consumption, and then replacing remaining emissions with low-carbon alternatives in line with the Paris Agreement. The Group plan to remove the remaining emissions that cannot be reduced or replaced by procuring, in accordance with prevailing regulatory requirements, high-quality offsets at a later stage.
In October 2020, the Group announced an ambition to reduce its energy consumption by 50% by 2030, against a 2019 baseline. In 2022, HSBC Bank plc implemented energy efficiency measures and a strategic reduction of our office footprint, across our office spaces and data centres.
These measures include:
• Embedding 100% renewable energy in our Germany offices;
• Further installation of LED lighting and optimisation of lighting timing controls in France, Switzerland, Spain and Germany; and
• Improvements to heating, ventilation and air conditioning systems throughout the HSBC Bank plc office portfolio to reduce energy consumption and increase efficiency.
As part of the Group's ambition to achieve 100% renewable power across our operations by 2030, HSBC Bank plc continue to look for opportunities to procure green energy in each of our markets.
HSBC Bank plc is managing the gradual resumption of employee travel in line with the Group's aim to halve travel emissions by 2030 compared with pre-pandemic levels.
For further information on the transition to net zero, please see the ESG review in the Group's Annual Reports and Accounts for the year ended 31 December 2022.
Supporting our Customers
The Group understands that financial institutions have a critical role to play in achieving the transition to a net zero global economy. The most significant contribution we can make is by mobilising finance to support our portfolio of customers in their transition to decarbonise.
Since 2020, HSBC Bank plc has supported our customers' transition to net zero and helped build a sustainable future by providing and facilitating $86.2bn of sustainable finance, $18.9bn of sustainable investment and $0.1bn of sustainable infrastructure, as defined in the Group's Sustainable Finance Data Dictionary 2022.
This financing and investment contributes towards the Group's ambition to provide and facilitate $750bn to $1tn of sustainable financing and investment by 2030. The $86.2bn of sustainable finance includes lending facilities provided and capital markets facilitated transactions.
Given the Group's global presence and relationships with our customers across industries, the Group recognise the role it can play in catalysing the global transition to net zero. The Group is well positioned to finance the transition in developing and emerging economies, mobilising capital to help enable sustainable business models and an inclusive, just and resilient transition.
For example, in 2022, HBCE acted as a sustainability coordinator, book runner and mandated lead arranger for a $150m sustainability-linked revolving credit facility for company: Nordic Semiconductor. The technology company which specialises in designing ultra-low power performance wireless systems, incorporated for the first time, sustainability-linked key performance indicators and an ESG roadmap within its business to help achieve their sustainability targets by 2030.
The breakdown of the Group's sustainable finance and investment progress is included in its ESG Data pack. The detailed definitions of the contributing activities for sustainable finance are available in the Group's Sustainable Finance Data Dictionary 2022. For the Group's ESG Data Pack, Sustainable Finance Data Dictionary and PwC Assurance Report, see www.hsbc.com/who-we-are/esg-and-responsible-business/esg-reporting-centre.
Unlocking New Climate Solutions
The Group understands the need to find new solutions to increase the pace of change if the world is to achieve the Paris Agreement's goal of net zero by 2050. Therefore, the Group is working closely with a range of partners to accelerate investment in natural resources, technology and sustainable infrastructure to reduce emissions and help address climate change.
HSBC Group partnered with the World Resources Institute and World Wildlife Fund ('WWF') in 2020 to launch its $100m philanthropic programme, Climate Solutions Partnership, with the aim to accelerate support for innovative solutions tackling climate change. This five-year philanthropic initiative aims to identify and remove barriers to scale for climate change solutions. As part of this, in France, two projects are being delivered in partnership with the French National Forestry Office and the Earthworm Foundation. These projects aim to better enable CO2 capture, preserve biodiversity and engage the community, helping to support a net zero and sustainable future.
| Our Global Businesses |
The Group manages its products and services through its three global businesses: Global Banking and Markets ('GBM'); Commercial Banking ('CMB'); Wealth and Personal Banking ('WPB'); and the Corporate Centre (comprising: certain legacy assets, central stewardship costs, and interests in our associates and joint ventures).
| Business segments |
Our operating model has the following material segments: a GBM business which is further split into three reportable segments: MSS, GB and GBM Other (as defined below), CMB, WPB and a Corporate Centre. These segments are supported by Digital Business Services and eleven global functions, including Risk, Finance, Compliance, Legal, Marketing and Human Resources.
| Markets & Securities Services ('MSS') |
Global Banking ('GB') |
GBM Other |
Commercial Banking ('CMB') |
Wealth and Personal Banking ('WPB') |
| Markets & Securities Services is a products group that services customers of all Global Businesses and institutional clients across the financial sector globally. We offer clients a range of services and capabilities including trading, financing and securities services across asset classes and geographies, supported by dedicated sales and research teams. Our European teams play a key role in providing access to FX, commodities, Equities and Fixed Income offerings, bridging emerging and developed markets, and collaborating with other global businesses to provide clients across the Group with commoditised and bespoke solutions that seek to support their growth ambitions. |
Global Banking delivers tailored financial solutions to corporate and institutional clients worldwide opening up opportunities through the strength of our global network and capabilities. We provide a comprehensive suite of services including capital markets, advisory, lending, trade services and global payments services. |
GBM Other primarily comprises Principal Investments and GBM's share of the Group's Markets Treasury function. |
We have a clear strategy to be the leading international corporate bank in Europe. We help connect our European customers to our international network of relationship managers and product specialists; supporting their growth ambitions and targets. Our products are designed to support clients in their international growth and range from term loans to region-wide treasury and trade solutions. We see the greatest opportunity to deliver and grow value for the Group by supporting European clients with international subsidiaries in Asia and other regions; our internal performance measures are aligned to this outcome. Commercial Banking is at the centre of creating revenue synergies within the Group: we collaborate closely with our Global Banking and Markets colleagues to provide expertise in capital finance and advisory solutions to support our Commercial Banking clients. Our trade teams within Commercial Banking also provide import and export finance solutions to Global Banking and Markets clients. We also support our clients to unlock efficiencies in their Treasury structures through our Global Payments Solutions team. As the European economy pivots to a net zero carbon economy, we are expanding our services and products to provide customers with innovative sustainable finance solutions and ensuring our relationship managers are positioned to support our clients' transition to net zero. |
In Europe, Wealth and Personal Banking serves customers with their financial needs through a number of business areas including Retail Banking, Private Banking, Wealth Management, Insurance and Asset Management. |
| Adjusted profit/(loss) before tax by business segment |
||||
| £472m |
£486m |
£(329)m |
£785m |
£577m |
| (2021: £(8)m); (2020: £20m) |
(2021: £589m); (2020: £55m) |
(2021: £99m); (2020: £(52)m) |
(2021: £490m); (2020: £152m) |
(2021: £323m); (2020: £(132)m) |
Our global businesses are presented on an adjusted basis, which is consistent with the way in which we assess the performance of our global businesses.
| ESG Overview |
We conduct our business to support the sustained success of our customers, employees and other stakeholders.
| Our approach |
We are guided by the Group's purpose to open up a world of opportunity for our colleagues, customers and communities. Our purpose is underpinned by the Group's values: we value difference; we succeed together; we take responsibility; and we get it done. The Group's purpose and values help us to deliver our strategy and unlock long-term value for our stakeholders.
As an international bank with significant breadth and scale, we understand that our climate, economies, societies, supply chains and people's lives are interconnected.The Group recognise they can play an important role in tackling ESG challenges. The Group focuses its efforts on three areas: the transition to net zero, building inclusion and resilience, and acting responsibly.
Fair outcomes
We are focused on running a strong and sustainable business that puts the customer first, values good governance, and gives our stakeholders confidence in how we do what we do. Our conduct approach helps to guide us to do the right thing and to focus on the impact we have for our customers and the financial markets in which we operate. For further information on conduct, see page 6. For further details on our purpose-led conduct approach framework, see www.hsbc.com/who-we-are. Our section 172 statement, detailing our Directors' responsibility to stakeholders, can be found on page 12.
Our colleagues
We aspire to open up a world of opportunity for our colleagues and build an inspiring, dynamic culture where the best talent want to work.
We value difference and we continue to build an inclusive workforce that is representative of the communities we serve. We set and report on progress made against the Group-wide gender and ethnic diversity goals.
Understanding the experience of colleagues is central to our efforts. Through our employee Snapshot survey, we capture our colleagues' views on topics such as hybrid working and well-being. In 2022, over 8,000 colleagues responded to the survey across Europe, a participation rate of 54%. Developing the skills of colleagues is critical to energising our organisation. We foster a culture of learning through a range of resources that provide colleagues with a breadth of educational materials and development opportunities.
Our Climate ambition
The Group has set a climate ambition to become net zero in its operations and its supply chain by 2030, and align its financed emissions to the Paris Agreement goal of net zero by 2050. In 2022, the Group expanded coverage of sectors for on-balance sheet financed emissions targets, recognising the challenge of evolving methodologies and data limitations.
Transition to net zero represents one of the Group's four strategic pillars. At the core of it is an ambition to support our customers on their transition to net zero, so that the greenhouse gas emissions from our portfolio of clients reaches net zero by 2050. The summary of the Group's Transition to net zero disclosure can be found on page 47 of the HSBC Holdings plc ESG review 2022.
Engaging with our stakeholders |
Engaging with our stakeholders is core to being a responsible business. To determine material topics that our stakeholders are interested in, we conduct a number of activities throughout the year, including engagements outlined in the table below.
| Our stakeholders |
How we engage |
Material topics highlighted by the engagement |
| Customers |
Our customers' voices are heard through our interactions with them, surveys and by listening to their complaints |
Customer advocacy |
| Employees |
Our colleagues' voices are heard through our employee Snapshot survey, Exchange meetings, and our 'speak-up' channels, including our global whistleblowing platform, HSBC Confidential |
Employee training |
| Investors |
Our ordinary shares are held by our parent HSBC Holdings plc, however external parties invest in our bond issuance. We engage with these investors via our investor relations programme which enables investor queries alongside a broader programme of management meetings and market engagement |
Strategic progress ESG policies Risk management
|
| Communities |
We welcome dialogue with external stakeholders, including non-governmental organisations ('NGOs') and other civil societies groups. We engage directly on specific issues and by taking part in external forums and working groups |
Financial Inclusion and Community Investment |
| Regulators and governments |
We proactively engage with regulators and governments to facilitate strong relationships via virtual and in-person meetings, responses to consultations individually and jointly via the industry bodies |
Anti-bribery and Corruption |
| Suppliers |
Our ethical and environmental code of conduct for suppliers of goods and services sets out how we intend to engage with our suppliers on ethical and environmental performance |
Supply Chain Management Human Rights |
Supporting our stakeholders facing a rising cost of living
We know that many of our customers are facing increasing cost of living pressures from higher inflation, and we are committed to helping them. Colleagues across our global businesses have been contacting our customers to provide them with access to support.
| Our ESG metrics and targets |
The Group has established targets that guide how we do business, including how we operate and how we serve our customers. These include targets designed to help us achieve our environmental and social sustainability goals.
They also help us to improve employee advocacy, the diversity of senior leadership and strengthen our market conduct.
The targets for these measures are linked to the pillars of our ESG strategy: transitioning to net zero, building inclusion and resilience, and acting responsibly.
To help us achieve our ESG ambitions, a number of measures are included in the annual incentive scorecards of the Europe Chief Executive and Executive Committee members.
Below we set out how we have made progress against the ESG-related ambitions and targets.
Environmental - Transition to net zero
One of the Group's strategic pillars is to support the transition to a net zero global economy. The Group's ambition is to align its financed emissions to the Paris Agreement goal to achieve net zero by 2050. The Paris Agreement aims to limit the rise in global temperatures to well below 2°C, preferably to 1.5°C, above pre-industrial levels.
The transition to net zero is one of the biggest challenges for our generation. Success will require governments, customers and finance providers to work together. The Group's global footprint means that many of its clients operate in high-emitting sectors and regions that face the greatest challenge in reducing emissions. This means that the Group's transition will be challenging but is an opportunity to make an impact.
The Group recognises that to achieve its climate ambition it needs to be transparent on the opportunities, challenges, related risks and progress it makes. To deliver on the ambition requires enhanced processes and controls, and new sources of data. The Group continues to invest in climate resources and skills, and develop its business management process to integrate climate impacts. Until systems, processes, controls and governance are enhanced, certain aspects of the Group's reporting will rely on manual sourcing and categorisation of data. In 2023, the Group will continue to expand its disclosures. Reporting will need to evolve to keep pace with market developments.
At the end of 2022, HSBC Bank plc achieved 63% cumulative reduction in absolute operational greenhouse gas emissions compared to a 2019 baseline in France, Germany, Switzerland and Malta. HSBC Bank plc continues to work to support the Group's ambition to achieve net zero in its own operations and supply chain by 2030.
Since 2020, HSBC Bank plc has supported our customers' transition to net zero and helped build a sustainable future by providing and facilitating $86.2bn of sustainable finance, $18.9bn of sustainable investment and $0.1bn of sustainable infrastructure, as defined in the Group's Sustainable Finance Data Dictionary 2022. This financing and investment contributes towards the Group's ambition to provide and facilitate $750bn to $1tn of sustainable financing and investment by 2030. The $86.2bn of sustainable finance includes lending facilities provided and capital markets facilitated transactions.
We continue to engage with our clients on their transition plans and to provide them with financing solutions to support their sustainability goals.
For further information regarding the Group's environmental footprint, please visit https://www.hsbc.com/who-we-are/our-climate-strategy/becoming-a-net-zero-bank.
Social - Build inclusion and resilience
• Our Snapshot employee engagement1 score was 47% as at the end of 2022, an increase of 1% compared to 2021;
• Our ethnic diversity goal2 for 2022 was to increase black heritage colleagues in senior leadership roles in the UK to 2.2%. We exceeded this target and reached 2.4%; and
• In 2022, we reached 24.6% senior leadership3 roles held by women up from 23.8% in 2021.
Governance - Acting responsibly
96%4 of HSBC Bank plc staff completed conduct training in 2022, which covers Conduct and Regulatory Compliance topics including: market abuse, conflicts of interest and treating customers fairly.
1 Employee engagement index is our headline measure of how employees feel about HSBC. HSBC Bank plc's score is low compared to the Group, key contributors are ongoing transformation and the challenging external environment in Europe. However, we are seeing year on year improvements and will continue to embed a positive and inclusive culture where our colleagues can thrive.
2 Our 2022 ethnicity goal of 2.2% includes UK RFB and NRFB.
3 Senior leadership is classified as those at band 3 and above in the Group's global career band structure. Our 2022 gender diversity target of 26.4% is cascaded by Group and inclusive of our operations in Bermuda; we reached 25.1% by end of 2022 at the regional level. We missed our 2022 target, our focus on improving gender balance in senior leadership across Europe remains a priority for HSBC Bank plc executive committee for 2023.
4 The completion rate shown relates to the 2021/22 'Taking Responsibility' Compliance training module which is categorised as 'required' learning for Global employees. Unlike with mandatory training, a formal target is not established for 'required' learning modules and non-completion is performance managed.
| Responsible Business Culture |
We have the responsibility to protect our customers, our communities and the integrity of the financial system. In this section, we outline our requirements under the Non-Financial Reporting Directive.
Environmental matters
More information about the Group's assessment of climate risk can be found in the HSBC Holdings plc Annual Report and Accounts 2022.
Employee matters
We are opening up a world of opportunity for our colleagues through building an inclusive organisation that values difference, takes responsibility and seeks different perspectives for the overall benefit of our customers.
We promote an environment where our colleagues can expect to be treated with dignity and respect. We are an organisation that acts where we find behaviours that fall short. Our index measuring colleagues' confidence in speaking up is at 67% in 2022.
At times our colleagues may need to speak up about behaviours in the workplace. We encourage colleagues to speak to their line manager in the first instance, and our annual employee Snapshot survey showed 82% feel comfortable doing so. We recognise that at times people may not feel comfortable speaking up through the usual channels. HSBC Confidential is our global whistleblowing channel, allowing our colleagues past and present to raise concerns confidentially and, if preferred, anonymously (subject to local laws).
We aspire to be an organisation that is representative of the communities which we serve. To achieve this, we set goals that will build sustainable lasting change. We are focused on increasing women and black heritage colleagues in senior leadership roles and whilst we have made good progress, we know there is more to be done.
To support our ambition, we encourage our colleagues to self-identify their ethnicity data where legally permissible. At a European level, we are limited in our collection of ethnicity data and can only report in: UK, Channel Islands and the Isle of Man ('CIIOM'), and South Africa. However, we are continuing to drive open dialogue and action to strengthen our employee networks and improved our diversity data where possible.
Communities
The Group has a long-standing commitment to help support the communities in which it operates. Through charitable partnerships and volunteering opportunities, our people share their skills and create a positive impact on society. The Group's global reach is its unique strength and bringing together diverse people, ideas and perspectives, helps us open up opportunities and build a more inclusive world.
In 2022, HSBC Bank plc continued to work with our charity partners across Europe to promote employability and financial capabilities in disadvantaged communities, and respond to local needs:
- HBCE partnered with charities Cresus and Adie to deliver programmes that enhance financial capability and entrepreneurship amongst disadvantaged individuals in their respective communities.
- HBMT supported local disadvantaged young people through its charitable partnership with the Prince's Trust Foundation and the 'Prince's Trust International Achieve programme' to develop employable skills.
In 2022, HSBC Bank plc collectively donated £1.8m to charitable programmes and was further supported by our employees' contribution of 1,540 volunteer hours in various community activities and projects during work time.
Human rights
Our commitment to respecting human rights, principally as they apply to our employees, our suppliers and through our financial services lending, is set out in our Statement on Human Rights. This statement, along with our statements under the UK's Modern Slavery Act, is available on www.hsbc.com/who-we-are/esg-and-responsible-business/esg-reporting-centre.
Anti-corruption and anti-bribery
We are committed to high standards of ethical behaviour and operate a zero-tolerance approach to bribery and corruption. We consider such activity to be unethical and contrary to good corporate governance.
HSBC requires compliance with all applicable anti-bribery and corruption ('AB&C') laws in all markets and jurisdictions in which we operate. These include the UK Bribery Act and France's 'Sapin II' law. We have a global AB&C policy, which gives practical effect to these laws and regulations, but also requires compliance with the spirit of laws and regulations to demonstrate our commitment to ethical behaviours and conduct as part of our environmental, social and corporate governance.
The global AB&C policy sets out the key principles and minimum control requirements that enable HSBC to mitigate bribery and corruption risk. Mandatory AB&C training is provided to all staff, with additional targeted training tailored to the roles of individuals. HSBC carries out regular risk assessments, monitoring and testing of its AB&C programme and maintains clear whistleblowing policies and processes to ensure that individuals can confidentially report concerns.
Non-Financial Information Statement
Disclosures required pursuant to the Companies, Partnerships and Groups (Accounts and Non-Financial Reporting) Regulations 2016 can be found on the following pages:
| Environmental matters (including the impact of the company's business on the environment) |
Page 11 |
| The company's employees |
Pages 10 to 13 and 101 to 102 |
| Social matters |
Page 11 |
| Respect for human rights |
Page 12 |
| Anti-corruption and anti-bribery matters |
Page 12 |
| Business model |
Page 9 |
| Principal risks |
Page 24 |
HSBC creates value by providing products and services to meet our customers' needs. We aim to do so in a way that fits seamlessly into their lives. This helps us to build long-lasting relationships with our customers. HSBC maintains trust by striving to protect our customers' data and information, and delivering fair outcomes for them and if things go wrong, we need to address complaints in a timely manner.
Operating with high standards of conduct is central to our long-term success and underpins our ability to serve our customers. Our Conduct Framework guides activities to strengthen our business and increases our understanding of how the decisions we make affect customers and other stakeholders. Details on our Conduct Framework are available at www.hsbc.com/Conduct.
| Section 172 statement |
This section, from pages 12 to 13 forms our section 172 statement and addresses the requirements of the Companies (Miscellaneous Reporting) Regulations 2018. It describes how the Directors have performed their duty to promote the success of the bank, including how they have considered and engaged with stakeholders and, in particular, how they have taken account of the matters set out in section 172(1)(a) to (f) of the Companies Act 2006 (the 'Act').
The Board considered a range of factors when making decisions and is supported in the discharge of its responsibilities by:
a. an induction programme and ongoing training for Directors to provide an understanding of our business and financial performance and prospects;
b. management processes which help ensure that proposals presented to Board and committee meetings for decision include information relevant to determine the action that would most likely promote the success of the bank and involve engagement with stakeholders where relevant, to support appropriate decision making; and
c. agenda planning for Board and committee meetings to provide sufficient time for the consideration and discussion of key matters.
Stakeholder Engagement
The Board understands the importance of effective engagement with its stakeholders and is committed to open and constructive dialogue. Engagement with stakeholders takes place at the holding company level and at the operational level. On certain issues, the Board may engage directly with stakeholders. The outcomes from such stakeholder engagement feeds into Board discussions and decision making. This approach allows the Board to better understand the impact of the bank's actions on its stakeholders and respond to the challenges facing the bank. The relevance of each stakeholder group varies depending on the specific decision being taken by the Board. Not every decision the Board makes will necessarily result in a positive outcome for all stakeholders.
As a result of both its direct stakeholder interactions and the reporting and information on stakeholder engagement it receives about its six key stakeholders, namely customers, employees, shareholders and investors, regulators and governments, suppliers, and communities, the Board seeks to understand, and have regard to, the interests and priorities of these stakeholders.
The two examples provided below of principal discussions and decisions taken by the Board in 2022 show how the Directors and Board respectively discharged their individual and collective responsibility for promoting the long-term success of the bank and took different stakeholder considerations into account in reaching a decision or forming a view.
For further details regarding the role of the Board and the way in which it makes decisions, including key activities during 2022, please see page 95 to 96.
Customers
As one of Europe's largest banking and financial services organisations our corporate and institutional customers are at the core of the bank's business model: without customers there would be no bank. We have a clear vision to be the leading international wholesale bank in Europe, complemented by a targeted wealth and personal banking business. The Board strives to ensure it has a broad understanding of customers, their needs and challenges, and to give full consideration to these when its approval is sought on matters such as material acquisitions, disposals, investments, large scale change or transformation programmes.
Throughout 2022, geopolitical and economic uncertainty has given our customers additional challenges and senior management have engaged directly with customers to better understand their issues and difficulties and how the bank can respond to them. During this period, the Board has been provided with customer feedback and key performance indicators, such as net promoter scores, customer complaints, customer on-boarding times and satisfaction survey results. The Board schedule also included Commercial Banking, Wealth and Personal Banking, Global Banking and Markets deep dive strategy sessions which incorporated discussions on customer interactions, customer surveys, complaints feedback and product developments to meet customers' needs.
Employee (Workforce Engagement)
Employees are critical to the success of the bank, its sustainability and long-term future. Understanding employee sentiment and how we are addressing feedback is a key area of Board focus. During the year, the Board received regular updates from senior management on the progression of our people priorities covering various employee-focused initiatives across culture, leadership, talent, skills, inclusion, wellbeing and colleague experience. Further information on people priorities can be found under Employee at page 101-112.
Feedback from employees is gathered via various mechanisms including surveys, exchange meetings and 'speak up' channels and reported to the Board. The Board is presented bi-annually with a culture dashboard which has been developed to track progress in embedding a positive and inclusive culture across the business. Board focus on employees was heightened due to the ongoing transformation programme and the need for continuing consideration of the impact on employees when making Board decisions.
The Board remained committed to building active communication and feedback channels with employees across the region in 2022. During the year, three cohorts were specifically targeted given their importance to the bank's strategy and their role in building a robust leadership pipeline. These included: i) Executive Committee member's direct reports, ii) Subsidiary Board members, and iii) Flagship Talent programme including participants from Accelerating Female Leaders, Explore, and Accelerating into Leadership programmes. Further details of the bank's engagement with employees can be found on pages 10 to 11 and 101 to 102.
Shareholders and Investors
The bank is a wholly owned subsidiary of HSBC Holdings plc and, as such, the Board took into account the implications of its decisions with regard to its shareholder, HSBC Holdings plc, and its debt security investors. Examples of how it fulfilled this include:
• the Board Chair and Committee Chairs engaged with Group counterparts and attended Group forums and Group committee meetings, together with Executive Directors, to engage on common issues and strategic priorities;
• Board review and approval of HSBC Bank plc specific components of Group programmes; and
• Board consideration of the strength of the balance sheet to ensure that the ability to pay principal or interest on its debt securities was not at risk.
Regulators and Governments
During the year, Directors met regularly with regulators both in the UK and Europe. It is central to the success of the bank that it has constructive relationships with regulators and governments and that there is a mutual understanding on expectations and challenges given their impact on customers, the business model and the bank's strategy.
The Board receives regular updates on how HSBC interacts with regulators globally and at the European level. Understanding regulators' views and priorities in this way shapes and influences Board discussions and decision making.
Suppliers
Suppliers are critical to supporting the infrastructure and operations of the business and we work with suppliers to ensure mutually beneficial relationships. Examples of Board engagement with suppliers during 2022 include:
• the Chief Operating Officer's regular reports on third-party supplier matters covering key suppliers' operational resilience and how we work with suppliers to mitigate impact to our customers; and
• oversight of progress of implementing contractual changes with third party suppliers to adopt new Standard Contractual Clauses to meet 'Schrems II decision' data requirements.
Communities
The bank has legal, regulatory and social responsibilities to the communities in which it operates and the environment and is conscious of the need to manage the societal and environmental impact of its business when making decisions. During the year the Board received regular updates on matters spanning human rights and environmental and climate issues.
Principal Decisions
Set out below are some of the principal decisions made by the Board during 2022. In each case, in taking such decisions, the Directors exercised their statutory duties under section 172(1) (a)-(f) of the Companies Act 2006.
Liability Management Exercise - Tender Offer
A key regulatory responsibility of the Board is to periodically assess the bank's capital and liquidity position and associated risks in a structured way, while also considering management proposals in support of the bank's financial strength and capital efficiency.
Mindful of the bank's continued focus on balance sheet optimisation, and broader regulatory expectations, management undertook an exercise to review potential liability management actions relating to its issued debt securities.
The review resulted in a formal proposal being brought to the Board, recommending the bank make an invitation to holders of certain legacy debt securities to tender any and all of such debt securities for purchase by the bank for cash, subject to certain conditions being satisfied.
Prior to approval, the Board constructively challenged and engaged with senior management to consider the capital and liquidity impact on the bank's balance sheet. As part of its considerations, the Board took in to account the impact of the project on the bank's key stakeholders, in particular its investors in such instruments and its obligations to, and relationship with, its regulators. In considering stakeholders, the Board also considered its minimum requirements for own funds and eligible liabilities and how the legacy securities were treated from a regulatory capital perspective.
In reaching its decision, the Board acknowledged the rationale for the proposal in the context of seeking to further enhance efficiencies in the bank's capital structure. The Board also acknowledged the Bank of England's ('BoE') resolvability assessment of major UK banks, which welcomed action being taken, where it is appropriate and proportionate to do so, to reduce the stock of legacy capital securities issued from non-resolution entities to holders outside the group. Having taken all of these and other factors into account, and subject to market and economic conditions, the Board approved the proposed tender offer in respect of the chosen legacy securities, which was subsequently announced on 14 November 2022.
European Transformation - Malta Transfer
For a number of years, management have considered the most appropriate organisational structure within Continental Europe to help execute the bank's Europe transformation strategy. In addition to this review, management acknowledged the need for banking entities to comply with the requirement under the CRD V to establish an EU IPU structure by the end of 2023. The review included a formal proposal being brought to the Board in October 2022, recommending the sale of HSBC Europe BV's entire shareholding in HBMT to the group's EU IPU, HBCE.
Prior to approval, the Board reviewed and assessed options presented by management to achieve compliance with the CRD V requirements. The Board constructively engaged with management to consider the financial and regulatory implications and the likely consequence of the proposal on the bank's key stakeholders, as appropriate. Mindful of longer-term consequences of decisions and the impact on operations, as well as HBMT's local listing, the Board also carefully considered the approach to valuation and purchaser protections for the transaction.
In reaching its decision, the Board acknowledged the rationale for the recommendation in the context of regulatory expectations and that HBCE had also provided its in-principle approval for the recommendation. Having taken these factors into consideration, including an assessment of the financial merits and risks, investor and regulatory engagement, the Board agreed to proceed with the proposal, as subsequently completed on 30 November 2022.
| Tax |
Our approach to tax
We are committed to applying both the letter and the spirit of the law in all territories where we operate, and have adopted the UK Code of Practice for the Taxation of Banks. As a consequence, we seek to pay our fair share of tax in the countries in which we operate. We continue to strengthen our processes to help ensure our banking services are not associated with any arrangements known or suspected to facilitate tax evasion.
HSBC continues to apply global initiatives to improve tax transparency such as:
• the US Foreign Account Tax Compliance Act ('FATCA');
• the Organisation for Economic Co-operation and Development ('OECD') Standard for Automatic Exchange of Financial Account Information (also known as the Common Reporting Standard);
• the CRD IV Country by Country Reporting;
• the OECD Base Erosion and Profit Shifting ('BEPS') initiative; and
• the UK legislation on the corporate criminal offence ('CCO') of failing to prevent the facilitation of tax evasion.
We do not expect the BEPS or similar initiatives adopted by national governments to adversely impact our results.
| Key Performance Indicators |
The Board of Directors tracks the group's progress in implementing its strategy with a range of financial and non-financial measures or key performance indicators ('KPIs'). Progress is assessed by comparison with the group strategic priorities, operating plan targets and historical performance. The group reviews its KPIs regularly in light of its strategic objectives and may adopt new or refined measures to better align the KPIs to HSBC's strategy and strategic priorities.
| Financial KPIs |
|||
|
|
2022 |
2021 |
2020 |
| (Loss)/profit before tax (reported) (£m) |
(959) |
1,023 |
(1,614) |
| Profit/(loss) before tax (adjusted) (£m) |
1,724 |
1,577 |
(184) |
| Cost efficiency ratio (reported) (%) |
115.2 |
89.2 |
113.6 |
| Cost efficiency ratio (adjusted) (%) |
70.9 |
80.9 |
89.6 |
| Return on tangible equity (%) |
5.5 |
6.1 |
(2.7) |
| Common equity tier 1 capital ratio (%) |
16.8 |
17.8 |
15.1 |
Profit/(loss) before tax (reported/adjusted): Reported profit/(loss) before tax is the profit/(loss) as reported under IFRS. Adjusted profit/(loss) before tax adjusts the reported profit/(loss) for the effect of significant items as detailed on pages 18 to 19.
Reported loss before tax in 2022 was £(959)m compared with a profit before tax of £1,023m in 2021. This was primarily driven by lower reported revenue, which reflected an impairment on the planned disposal of our retail banking operations in France and losses associated with the planned sale of our operations in Russia and Greece. Expected credit losses and other credit impairment charges ('ECL') were a net charge, largely reflecting stage 3 charges in Global Banking and CMB. This compared with a net release in 2021 primarily related to Covid-19 related allowances built up in 2020. Reported operating expenses were lower primarily driven by lower variable pay and the impact of our transformation cost-saving initiatives partly offset by higher restructuring and other related costs.
Share of profit/(loss) from associates recognised a loss of £30m compared with a gain of £191m in 2021.
Adjusted profit before tax was £1,724m, up £146m compared with £1,577m in 2021. This was driven by a strong revenue performance and lower operating expenses, partly offset by higher ECL. The increase in revenue was largely driven by higher net interest income in all of our global businesses, mainly due to interest rate rises. Revenue in Markets and Securities Services ('MSS') was also strong, mainly in Global Foreign Exchange and Equities. This was driven by increased client activity due to elevated market volatility and the macroeconomic impacts from rising inflation and increasing interest rates, and reflecting robust risk management. This was partly offset by lower valuation gains in Principal Investments ('PI') compared with 2021.
Operating expenses decreased, driven by lower performance related pay and the impact of our transformation cost-saving initiatives.
Reported cost efficiency ratio was 26.0 percentage points higher compared with 2021 driven by lower revenue partly offset by lower operating expenses. Reported revenue decreased by 24.1% and operating expenses decreased by 2.0%, mainly driven by the factors mentioned above.
Adjusted cost efficiency ratio improved by 10.0 percentage points from 2021, reflecting higher revenue and lower costs. Revenue increased by 7.1%, due to higher net interest income driven by the high interest rate environment and higher trading revenue in MSS. Operating expenses decreased by 6.1%, mainly driven by factors mentioned above.
Return on tangible equity ('RoTE') is computed by adjusting reported profit attributable to ordinary shareholders by excluding movements in PVIF and significant items (net of tax), divided by average tangible shareholders' equity excluding fair value of own debt, debit valuation adjustment ('DVA') and other adjustments for the period. The adjustment to reported results and reported equity excludes amounts attributable to non-controlling interests.
We provide RoTE as a way of assessing our performance, which is closely aligned to our capital positions.
CET1 capital ratio represents the ratio of common equity tier 1 capital to total risk-weighted assets ('RWA'). CET1 capital is the highest quality form of capital comprising shareholders' equity and related non-controlling interests less regulatory deductions and adjustments.
The group seeks to maintain a strong capital base to support the development of its business and meet regulatory capital requirements at all times.
The CET1 capital ratio of 16.8% in 2022 decreased by 1.0% from 2021, mainly due to an increase in RWAs.
| Non-financial KPIs |
We monitor a range of non-financial KPIs focusing on customers, people, culture and values, including customer service satisfaction, employee engagement and diversity and sustainability.
For details on customer service and satisfaction please refer below; for the remaining non-financial KPIs, refer to the Non-financial reporting section on page 11 and Corporate Governance section on pages 94 to 102.
Customer service, awards and satisfaction
MSS
Our customers are at the heart of what we do and we are committed to delivering services and capabilities that meet their needs and help them fulfil their ambitions.
In 2022, we won numerous awards and consistently ranked highly with our European clients, including winning Currency Manager of the Year at the European Pension Awards, Best Prime Broker - Emerging Markets at the HFM European Services Awards (for the 10th consecutive year), ranking number one for 'UK Research', 'UK Overall Broker' and 'Emerging EMEA Equity Research, Sales
and Corporate Access' in the Institutional Investor 2022 Survey and also ranking number one for 'UK Fund Accounting and Administration provider', 'Top 200 Asset Managers' and 'Rest of the World' in the R&M Investor Services Survey for Europe.
These accolades, coupled with multiple milestones and achievements in sustainable finance, demonstrate our leading capabilities to support clients locally and connect them to markets and expertise in the East, as well the key role Europe plays in supporting the Group's strategic priorities.
GB
Within Global Banking Europe we remain committed to providing excellent customer experience and continue to strive towards improving our proposition to meet client needs.
In 2022, HSBC received industry recognition across a number of product capabilities offered to our Global Banking clients including being recognised as number one Best Services for Trade Finance in Western Europe by Euromoney in their Trade Finance Survey and number one for Cash Management in the UK in the 2022 Euromoney Market Leaders survey.
Aligned with our purpose of opening up opportunities for our clients, HSBC also won six bond awards from Environmental Finance in 2022. These awards also highlight the continued strength and differentiation of our Sustainability capabilities globally as well as the role we play in Europe helping our clients transition to net zero.
CMB
Customer experience and satisfaction are priorities for Commercial Banking in Europe. We measure a number of operational metrics on customer service levels and gather direct customer feedback to ensure our solutions and channels remain relevant and fit for our customers' digital needs today. Our centralised booking model in Paris for our pan-European customers enables us to regionally cover and manage customers through a consistent and streamlined level of service.
This also ensures our Relationship Managers can support and cover customers using a common toolkit. Looking ahead, we will continue to measure how we deploy resources to our customers looking to expand and grow internationally, whilst also supporting them with their transition plans to achieve net zero.
WPB
Enhancing customer experience and improving satisfaction remains integral to our strategy. This is monitored through a number of customer satisfaction metrics covering branch, contact centre and digital channels. One example is iNPS ('Interactions Net Promoter Score') which measures interactions with our customers. In 2022 Channel Islands and Isle of Man ('CIIOM') Islands iNPS scored 14 against a target of 15 for mobile and 46 against a target of 50 for Premier Relationship Managers. The Expat proposition scored 24 against a target of 6 for Online, and Premier Relationship Managers scored 55 against a target of 46. We recognise the importance of customer feedback and continue to enhance our insights to gain a better understanding of our clients to provide a more personalised and relevant service.
Digital continues to be a principal area of investment; enhancing customer experience, reducing processing costs and driving the sustainability agenda. We are on track to transition 30% of cheques (up to the value of £500) away from the branch to mobile, improving customer service with 2,500 cheques deposited to date.
Private Banking remains committed to enhancing our digital capabilities and offering, with improved internal platforms and software to support the delivery of excellent client service. Within Switzerland, Luxembourg and Channel Islands service improvements have been delivered within the E-Banking platform including client access to on-demand statements.
We recognise that enhancing customer satisfaction is an evolving process and are committed to ensure our investments and focus are prioritised to achieve this.
| Economic background and outlook |
| UK |
Falling real incomes are driving the UK's economic slowdown
UK consumer price inflation remains very high. In January 2023, the annual inflation rate fell to 10.1%, the third consecutive monthly fall. While inflation may have peaked at 11.1% in October, cost pressures are still high and inflation could remain close to 10% through Q1 2023 before decreasing further. Thanks partly to falls in wholesale energy prices, the BoE forecasts that headline inflation could fall below 4% by Q4 2023.
Underlying inflation pressures could prove more persistent. In December 2022, UK services inflation hit its highest rate since 1992, though it fell back in January 2023. The UK labour market continues to be characterised by a constrained supply of workers, across sectors and skill levels, which could also add to core inflation pressure. The unemployment rate was close to multi-decade lows at 3.7% in the three months ended December 31, 2022. Wage growth, while strong, has not kept pace with inflation. Total nominal average weekly earnings were up 5.9% year-on-year in the three months ended December 31, 2022, while real pay on the same basis fell by 3.1%.
The real-terms income squeeze contributed to a fall in GDP of 0.2% quarter-on-quarter in Q3 2022, though an extra Bank Holiday for the Queen's funeral may also have played a role. However, GDP was flat in Q4 2022, meaning the UK economy narrowly avoided slipping into technical recession. Even so, the underlying growth picture still looks challenging.
The BoE has raised Bank Rate at each policy meeting since December 2021, taking it to 4.0% in February 2023. This has already started to weigh on the housing market, with benchmark price indices showing falls in October and November 2022. In early February 2023, market prices implied that UK Bank Rate would peak at over 4.5% in mid-2023 with cuts expected to begin from Q4 2023.
| Eurozone |
Headline inflation falling and growth slowing
The eurozone economy was resilient through the second half of 2022. GDP grew 0.3% quarter on quarter in Q3, with a strong contribution from household spending despite high inflation. Preliminary data showed that the eurozone economy expanded again in Q4 2022, with GDP rising 0.1% quarter on quarter. The modest expansion means the eurozone also avoided slipping in to recession in 2022. With household savings rates still high, this resilience partly reflects government support measures.
Eurozone inflation remains high, even though it is estimated to have already reached its peak, having hit an all-time high of 10.6% in October 2022 and falling to 8.5% in the preliminary estimate for January 2023.
These elevated rates of inflation will weigh on real-terms incomes and, in turn, household spending. As the recent falls in wholesale energy prices start to feed through to consumers, headline inflation should fall further during the course of 2023. Declines in core inflation have been less pronounced, with core inflation of 5.2% in January 2023.
The ongoing inflationary squeeze on real-terms incomes means that a mild eurozone recession still seems likely, even though indicators of economic activity in early 2023 were resilient. The depth of any recession should be backstopped by a supportive labour market, not least because in Europe many firms can make use of government-backed short-time working schemes.
| Financial summary |
| Use of alternative performance measures |
Our reported results are prepared in accordance with International Financial Reporting Standards ('IFRSs'), as detailed in the Financial Statements starting on page 113.
In measuring our performance, we supplement our IFRS figures with non-IFRS measures, which constitute alternative performance measures under European Securities and Markets Authority guidance and non-GAAP financial measures defined and presented in accordance with US Securities and Exchange Commission rules and regulations. These measures include those derived from our reported results in order to eliminate factors that distort year-on-year comparisons. The 'adjusted performance' measure used throughout this report is described below. All alternative performance measures are described and reconciled to the closest reported financial measure when used.
Adjusted performance
Adjusted performance is computed by adjusting reported results for the year-on-year effects of significant items that distort year-on-year comparisons.
We use 'significant items' to describe collectively the group of individual adjustments excluded from reported results when arriving at adjusted performance. These items are ones that management and investors would ordinarily identify and consider separately when assessing performance to understand better the underlying trends in the business. We consider adjusted performance provides useful information for investors by aligning internal and external reporting, identifying and quantifying items management believes to be significant and providing insight into how management assesses year-on-year performance.
| Summary consolidated income statement for the year ended |
|||
|
|
2022 |
2021 |
2020 |
|
|
£m |
£m |
£m |
| Net interest income |
1,904 |
1,754 |
1,898 |
| Net fee income |
1,261 |
1,413 |
1,400 |
| Net income from financial instruments measured at fair value |
1,751 |
3,432 |
2,314 |
| Gains less losses from financial investments |
(60) |
60 |
95 |
| Net insurance premium income |
1,787 |
1,906 |
1,559 |
| Losses/gains recognised on Assets held for sale |
(1,947) |
67 |
- |
| Other operating income |
356 |
527 |
417 |
| Total operating income1 |
5,052 |
9,159 |
7,683 |
| Net insurance claims, benefits paid and movement in liabilities to policyholders |
(406) |
(3,039) |
(1,783) |
| Net operating income before change in expected credit losses and other credit impairment charges2 |
4,646 |
6,120 |
5,900 |
| Change in expected credit losses and other credit impairment charges |
(222) |
174 |
(808) |
| Net operating income |
4,424 |
6,294 |
5,092 |
| Total operating expenses excluding impairment of goodwill and other intangible assets1 |
(5,365) |
(5,416) |
(5,903) |
| Impairment of goodwill and other intangible assets |
12 |
(46) |
(802) |
| Operating (loss)/profit |
(929) |
832 |
(1,613) |
| Share of (loss)/profit in associates and joint ventures |
(30) |
191 |
(1) |
| (Loss)/profit before tax |
(959) |
1,023 |
(1,614) |
| Tax credit |
561 |
23 |
136 |
| (Loss)/profit for the year |
(398) |
1,046 |
(1,478) |
| (Loss)/profit attributable to the parent company |
(408) |
1,041 |
(1,488) |
| Profit attributable to non-controlling interests |
10 |
5 |
10 |
1 Total operating income and expense include significant items as detailed on pages 16 to 19.
2 Net operating income before change in expected credit losses and other credit impairment charges is also referred to as revenue.
2
| Reported performance |
Reported loss before tax was £(959)m, compared with a profit before tax in 2021 of £1,023m, a decrease of £1,982m. The reported loss in 2022 included impairments of £1,947m, mainly due to the reclassification of our retail banking operations in France to held for sale, and net ECL charges compared with a net release in 2021. This was partly offset by a reduction in operating expenses.
Reported revenue was £1,474m lower, largely reflecting impairments on the planned disposals of our retail banking operations in France, and our operations in Russia and Greece in 2022. Revenue also decreased in GBM Other mainly driven by lower favourable valuation gains in PI and a net loss of £91m from the buy-back of legacy securities to optimise the bank's future funding costs.
This decrease was partly offset by a strong performance in Markets and Securities Services ('MSS') and higher revenue from interest rate rises, notably in Global Payments Solutions ('GPS') in Global Banking and CMB. During 3Q22, we renamed our Global Liquidity and Cash Management ('GLCM') business to Global Payments Solutions as we reshape our payments proposition
into a technology-enabled, globally connected payments franchise, to better support our clients' needs and facilitate commerce.
In WPB, revenue grew supported by higher interest rates and higher revenue in insurance manufacturing driven by assumption updates, primarily reflecting favourable investment assumptions on asset management rebates for unit-linked investments and profit-sharing levels.
Reported operating expenses decreased, mainly driven by lower performance-related pay and the impact of our transformation cost-saving initiatives. This was partly offset by higher restructuring and other related costs.
In addition, there was also a loss compared with a gain in 2021 recognised from our share of profit/(loss) from associates.
Net interest income ('NII') increased by £150m or 9% compared with the prior year. This included higher net interest expense in Corporate Centre (up by £565m compared with 2021) associated with funding of our Markets business in MSS generating trading income. Excluding this, NII was up by £694m mainly in CMB (£277m) and Global Banking (£335m) driven by the higher interest rate environment, notably in GPS.
Net fee income decreased by £152m or 11% compared with the prior year, notably in Global Debt Markets in MSS and Global Banking, driven by lower underwriting fees as market activity fell due
to the effect of the Russia-Ukraine war and wider macroeconomic uncertainties. This compared with a strong 2021 when corporates raised finance as initial Covid-19 restrictions were eased. This reduction was partly offset by higher income in GPS, as volumes grew and we delivered on our strategic initiatives.
Net income from financial instruments measured at fair value decreased by £1,681m or 49%, primarily in WPB. This decrease was driven by lower returns on financial assets supporting insurance contracts where the policyholder is subject to part or all of the investment risk.
This adverse movement resulted in a corresponding movement in liabilities to policyholders, reflecting the extent to which policyholders participate in the investment performance of the associated assets. The offsetting movements are recorded in net insurance claims and benefits paid and movement in liabilities to policyholders.
The decrease in WPB was partly offset by higher revenue in MSS, mainly reflecting strong client activity and robust risk management, notably in Global Foreign Exchange, due to elevated market volatility resulting from the Russia-Ukraine war and macroeconomic impacts from rising inflation and increasing interest rates. Revenue also benefited from favourable fair value movements in preference shares holdings in VISA in CMB and WPB.
Gains less losses from financial investments decreased by £120m, mainly driven by losses on the disposal of bonds held at fair value through other comprehensive income ('FVOCI') in Markets Treasury. This compared with gains in the prior year.
Net insurance premium income decreased by £119m or 6%, in WPB, from insurance manufacturing revenue driven by lower new business volumes.
Losses/gains recognised on Assets held for sale of £(1,947m) mainly driven by an impairment on the planned disposals of the retail banking operations in France £1,711m, branch operations in Russia of £212m and Greece of £87m in 2022. This compared with a gain of £65m from sale of a property in Germany in 2021.
Net insurance claims, benefits paid and movement in liabilities to policyholders decreased by £2,633m or 87% in the insurance business in WPB. The decrease was driven by lower returns on financial assets supporting contracts where the policyholder is subject to part or all of the investment risks.
The losses recognised on the financial assets measured at fair value through profit and loss that are held to support these insurance contract liabilities are reported in 'Net income from financial instruments designated at fair value'.
Other operating income decreased by £171m or 32%, mainly in GBM Other due to lower intercompany recharge recoveries from other entities in the Group, with an offsetting decrease in operating expenses. This was partly offset by higher revenue in insurance manufacturing in WPB driven by assumption updates.
Changes in expected credit losses and other credit impairment charges ('ECL') were a charge of £222m in 2022, compared with a release of £174m in 2021. The charge in 2022 was mainly driven by higher stage 3 charges in Global Banking and in CMB reflecting heightened levels of uncertainty and inflationary pressures. This compared with a net release of stage 1 and stage 2 allowances in 2021 primarily relating to Covid-19 related allowances built up in 2020.
Total operating expenses excluding impairment of goodwill and other intangible assets decreased by £51m or 1%, mainly driven by lower variable pay and the impact of continued cost discipline as well as lower intercompany costs recharges. This was partly offset by an increase of £137m in restructuring and other related costs.
Impairment of goodwill and other intangible assets was a release of £12m compared with an impairment charge on non-financial assets of £(46)m in 2021.
Share of (loss)/profit in associates and joint ventures was a loss of £30m compared with a profit of £191m in 2021 due to the recovery in asset valuations. The loss in 2022 included a £24m true-up of prior year valuations in the underlying investments of an associate.
Tax credit of £561m was £538m higher compared with 2021. The effective tax rate of 58.5% for 2022 was driven by underlying losses before tax, non-recurring items including recognition of previously unrecognised deferred tax assets in France and a tax credit of £105m from movement in provisions for uncertain tax positions.
The tax credit in 2021 of £23m included favourable non-recurring items in respect of tax rate changes, prior period adjustments and the recognition of previously unrecognised deferred tax assets in France.
| Adjusted performance |
| Significant revenue items by business segment - (gains)/losses for the year ended |
|||||||
|
|
MSS |
GB |
GBM Other |
CMB |
WPB |
Corporate Centre |
Total |
|
|
£m |
£m |
£m |
£m |
£m |
£m |
£m |
| 31 Dec 2022 |
|
|
|
|
|
|
|
| Reported revenue |
2,446 |
1,571 |
(108) |
1,433 |
(80) |
(616) |
4,646 |
| Significant revenue items |
(33) |
- |
100 |
(1) |
1,572 |
498 |
2,136 |
| - fair value movements on financial instruments1 |
(35) |
- |
(6) |
(1) |
- |
(1) |
(43) |
| - restructuring and other related costs2 |
2 |
- |
106 |
- |
- |
126 |
234 |
| - European restructurings |
- |
- |
- |
- |
1,572 |
373 |
1,945 |
| Adjusted revenue |
2,413 |
1,571 |
(8) |
1,432 |
1,492 |
(118) |
6,782 |
|
|
|||||||
| 31 Dec 2021 |
|
|
|
|
|
|
|
| Reported revenue |
2,043 |
1,367 |
310 |
1,096 |
1,276 |
28 |
6,120 |
| Significant revenue items |
12 |
- |
269 |
(1) |
(1) |
(69) |
210 |
| - fair value movements on financial instruments1 |
12 |
- |
(5) |
(1) |
(1) |
- |
5 |
| - restructuring and other related costs2 |
- |
- |
274 |
- |
- |
(69) |
205 |
| Adjusted revenue |
2,055 |
1,367 |
579 |
1,095 |
1,275 |
(41) |
6,330 |
|
|
|
|
|
|
|
|
|
| 31 Dec 2020 |
|
|
|
|
|
|
|
| Reported revenue |
1,966 |
1,381 |
437 |
1,132 |
1,035 |
(51) |
5,900 |
| Significant revenue items |
2 |
- |
187 |
1 |
- |
(93) |
97 |
| - fair value movements on financial instruments1 |
2 |
- |
2 |
1 |
- |
(2) |
3 |
| - restructuring and other related costs2 |
- |
- |
185 |
- |
- |
(91) |
94 |
| Adjusted revenue |
1,968 |
1,381 |
624 |
1,133 |
1,035 |
(144) |
5,997 |
1 Includes fair value movements on non-qualifying hedges and debit valuation adjustments on derivatives.
2 Includes losses associated with the RWA reduction commitments.
| Significant cost items by business segment - (recoveries)/charges for the year ended |
|||||||
|
|
MSS |
GB |
GBM Other |
CMB |
WPB |
Corporate Centre |
Total |
|
|
£m |
£m |
£m |
£m |
£m |
£m |
£m |
| 31 Dec 2022 |
|
|
|
|
|
|
|
| Reported operating expenses |
(1,940) |
(932) |
(402) |
(663) |
(917) |
(499) |
(5,353) |
| Significant cost items |
- |
- |
84 |
70 |
9 |
384 |
547 |
| - restructuring and other related costs |
- |
- |
68 |
61 |
2 |
327 |
458 |
| - European restructurings |
- |
- |
16 |
9 |
7 |
57 |
89 |
| Adjusted operating expenses |
(1,940) |
(932) |
(318) |
(593) |
(908) |
(115) |
(4,806) |
|
|
|||||||
| 31 Dec 2021 |
|
|
|
|
|
|
|
| Reported operating expenses |
(2,064) |
(918) |
(588) |
(611) |
(981) |
(300) |
(5,462) |
| Significant cost items |
- |
- |
103 |
(1) |
6 |
236 |
344 |
| - restructuring and other related costs |
- |
- |
103 |
(1) |
6 |
213 |
321 |
| - European restructurings |
- |
- |
- |
- |
- |
23 |
23 |
| Adjusted operating expenses |
(2,064) |
(918) |
(485) |
(612) |
(975) |
(64) |
(5,118) |
|
|
|
|
|
|
|
|
|
| 31 Dec 2020 |
|
|
|
|
|
|
|
| Reported operating expenses |
(1,950) |
(878) |
(1,351) |
(773) |
(1,169) |
(584) |
(6,705) |
| Significant cost items |
1 |
- |
679 |
114 |
41 |
498 |
1,333 |
| - restructuring and other related costs |
- |
- |
218 |
79 |
5 |
377 |
679 |
| - European restructurings |
- |
- |
- |
- |
- |
- |
- |
| - settlements and provisions in connection with legal and regulatory |
1 |
- |
- |
- |
- |
8 |
9 |
| - impairment of other intangible assets |
- |
- |
461 |
35 |
36 |
113 |
645 |
| Adjusted operating expenses |
(1,949) |
(878) |
(672) |
(659) |
(1,128) |
(86) |
(5,372) |
| Net impact on profit/(loss) before tax by business segment |
|||||||
|
|
MSS |
GB |
GBM Other |
CMB |
WPB |
Corporate Centre |
Total |
|
|
£m |
£m |
£m |
£m |
£m |
£m |
£m |
| 31 Dec 2022 |
|
|
|
|
|
|
|
| Reported profit/(loss) before tax |
505 |
486 |
(513) |
716 |
(1,004) |
(1,149) |
(959) |
| Net impact on reported profit and loss |
(33) |
- |
184 |
69 |
1,581 |
882 |
2,683 |
| - Significant revenue items |
(33) |
- |
100 |
(1) |
1,572 |
498 |
2,136 |
| - Significant cost items |
- |
- |
84 |
70 |
9 |
384 |
547 |
| Adjusted profit/(loss) before tax |
472 |
486 |
(329) |
785 |
577 |
(267) |
1,724 |
|
|
|||||||
| 31 Dec 2021 |
|||||||
| Reported profit/(loss) before tax |
(20) |
589 |
(273) |
492 |
318 |
(83) |
1,023 |
| Net impact on reported profit and loss |
12 |
- |
372 |
(2) |
5 |
167 |
554 |
| - Significant revenue items |
12 |
- |
269 |
(1) |
(1) |
(69) |
210 |
| - Significant cost items |
- |
- |
103 |
(1) |
6 |
236 |
344 |
| Adjusted profit/(loss) before tax |
(8) |
589 |
99 |
490 |
323 |
84 |
1,577 |
|
|
|
|
|
|
|
|
|
| 31 Dec 2020 |
|||||||
| Reported profit/(loss) before tax |
17 |
55 |
(918) |
37 |
(173) |
(632) |
(1,614) |
| Net impact on reported profit and loss |
3 |
- |
866 |
115 |
41 |
405 |
1,430 |
| - Significant revenue items |
2 |
- |
187 |
1 |
- |
(93) |
97 |
| - Significant cost items |
1 |
- |
679 |
114 |
41 |
498 |
1,333 |
| Adjusted profit/(loss) before tax |
20 |
55 |
(52) |
152 |
(132) |
(227) |
(184) |
Adjusted profit before tax was £1,724m, up £147m or 9% compared with 2021. This reflected higher revenue and lower operating expenses partly offset by higher ECL and a loss in our share of profit in associates and joint ventures compared with a gain in 2021.
Adjusted revenue increased by £452m or 7% compared with 2021. This increase was primarily in Global Payments Solutions ('GPS') within Global Banking and CMB, driven by the positive impact of interest rate rises and balance sheet growth. In MSS, strong revenue performance, notably in Global Foreign Exchange, Securities Services and Equities, was driven by strong client activity and robust risk management. Revenue also increased in WPB reflecting higher net interest income driven by rising interest rates and higher revenue in insurance manufacturing driven by assumption updates.
This increase was partly offset by a reduction in GBM Other, mainly driven by lower favourable valuation gains in PIs and a net loss from the buy-back of legacy securities to optimise the bank's future funding costs.
Adjusted ECL were a net charge of £222m compared with a net credit of £174m in 2021. In 2022, the net charge was mainly driven higher stage 3 charges in Global Banking and CMB. This compared with a net release of stage 1 and stage 2 allowances in 2021 reflecting an improved economic outlook and stabilisation of credit risk.
Adjusted operating expenses decreased by £312m or 6%, mainly reflecting the impact of our transformation cost-saving initiatives and lower performance-related pay. In addition, there was a lower UK bank levy charge, which included a credit of £44m relating to 2021 charges, and lower VAT costs in France due to an update in the VAT recovery rate and the recognition of a recovery of VAT paid in 2021.
Share of (loss)/profit in associates and joint ventures was a loss of £30m compared with a profit of £191m in 2021. The loss in 2022 included a £24m true-up of prior year valuations in the underlying investments of the Business Growth Fund ('BGF').
Markets and Securities Services
Adjusted profit before tax was £472m compared with a loss before tax of £(8)m in 2021. This was driven by strong revenue performance and lower operating expenses.
Adjusted revenue increased by £358m or 17%, mainly in Global Foreign Exchange (up by £305m). This was driven by increased client activity due to elevated market volatility and the macroeconomic impacts from rising inflation, increasing interest rates and a strengthening of the US dollar, resulting in a strong trading performance. Revenue also increased in Securities Services (up £72m) driven by higher interest rates and transaction volumes. In Equities, revenue was higher by £32m as 2022 included a one-off gain on disposal of an associate of £61m following a merger event. This increase was partly offset lower client activity as a result of inflation concerns and lack of investor appetite in 2022.
In Securities Financing, revenue was down by £49m, mainly due to margin compression in repurchase agreements ('repos'). This reflected volatility due to the macro-economic environment, including central bank policies on interest rates. By contrast, revenue was up in Prime Finance driven by growth in client franchise revenue, up 10%, despite challenging market conditions.
Revenue also decreased in Global Debt Markets (down by £23m), mainly driven by lower primary issuances and reduced client activity due to challenging market conditions.
Adjusted operating expenses decreased by £124m or 6%, largely driven by a decrease in performance-related pay and the impact of our transformation cost-saving initiatives; partly offset by the impact of higher inflation.
Global Banking
Adjusted profit before tax was £486m, a decrease of £103m or 17% compared with 2021. This was largely driven by higher ECL, partly offset by higher revenue.
Adjusted revenue increased by £204m or 15%, mainly in GPS (up by £389m) driven by margin growth reflecting the rising global interest rate environment and strategic initiatives to grow fee income. In contrast, Capital Markets and Advisory revenue decreased by £124m, in line with the reduced market fee pool and adverse valuation movements on leveraged loans.
Adjusted ECL were a net charge of £153m compared with a net credit of £139m in 2021. The net charge in 2022 was mainly driven by higher stage 3 charges, notably in non-bank financial institutions and real estate sectors. This compared with a net release of stage 1 and stage 2 allowances in 2021 primarily relating to Covid-19 related allowances built up in 2020.
Adjusted operating expenses were £14m or 2% higher compared with 2021, reflecting the impact of higher inflation and strategic investments, partly offset by the impact of our ongoing cost discipline.
Global Banking and Markets Other
Adjusted loss before tax was £(329)m, compared with a profit before tax of £99m in 2021. This was largely driven by lower revenue, partly offset by lower operating expenses.
Adjusted revenue decreased by £587m, mainly in PIs driven by lower valuation gains of £209m compared with 2021. Revenue also decreased driven by a net loss from the buy-back of legacy securities to optimise the bank's future funding costs, and also lower intercompany recoveries of costs from other entities in the Group. There was also a decrease in revenue allocated from Markets Treasury.
Adjusted operating expenses decreased by £167m or 35% compared with 2021, reflecting the move of certain GBM costs from the bank to other entities in the Group (offset by lower intercompany recoveries in revenue). The decrease in operating expenses was also driven by lower UK Bank levy in 2022, which included a credit relating to 2021 charges.
Commercial Banking
CMB performed strongly in 2022 as we continued to implement our strategy to focus on serving our international customers.
Adjusted profit before tax was £785m, up by £295m compared with 2021. This was mainly driven by higher revenue and lower operating expenses, partly offset by ECL charges.
Adjusted revenue increased by £337m or 31% compared with 2021. This was primarily in GPS (up by £294m) driven by the higher interest rate environment and growth in average deposit balances. There was also an increase in collaboration revenue from MSS products (up £36m), notably Global Foreign Exchange. Additionally, revenue also benefited from favourable fair value movements in our holding of preference shares in VISA and an increase in revenue from Markets Treasury.
This was partly offset by a decrease in Credit and Lending revenue of £43m, in part due to an increase in the cost of funds.
Adjusted ECL were a net charge of £54m compared with a net release of £7m in 2021. The net charge in 2022 was largely driven by stage 3 charges in France and Germany, partly offset by a release of stage 1 and stage 2 allowances. This compared with a net release in 2021 of Covid-19-related allowances previously built up in 2020.
Adjusted operating expenses decreased by £19m or 3%, driven by continued cost discipline on discretionary spend and
through hiring efficiencies, as well as from the impact of our cost-saving initiatives. The decrease was also driven by an update in the VAT recovery rate and the recognition of a recovery of VAT paid in 2021 in France.
Wealth and Personal Banking ('WPB')
Adjusted profit before tax of £577m, up £254m compared with 2021. This was primarily due to higher revenue and lower operating expenses, partly offset by higher ECL.
Adjusted revenue increased by £217m or 17%, mainly CIIOM from deposits (up £147m) due to the higher interest rate environment and growth in average balances. Revenue also increased in insurance manufacturing (up by £58m) due to assumptions changes and experience variances, primarily reflecting favourable investment assumptions on asset management rebates for unit-linked investments and profit-sharing levels. There were also favourable fair value movements in our holding of preference shares in VISA of £33m.
Adjusted ECL were a net charge of £7m compared with a net release of £23m in 2021. The net charge in 2022 mainly reflected a more normalised level of charges including provisions relating to a deterioration in the forward economic outlook due to heightened levels of uncertainty and inflationary pressures. The net release in 2021 was from Covid-19-related allowances previously built up in 2020.
Adjusted operating expenses decreased by £67m or 7%. This was driven by the benefits of our cost-saving initiatives and a reduction due to the increase in the VAT recovery rate and the recognition of a recovery of VAT paid in 2021 in France.
Corporate Centre
Adjusted loss before tax of £267m compared with a profit before tax of £84m in 2021. This was mainly driven by a loss in associates and joint ventures compared with a gain in the first half of 2021, as well as lower revenue.
Adjusted revenue was lower by £77m, mainly driven by the non-recurrence of a fair value gain of £32m in 2021 from a long-standing investment in a Germany-based brokerage company. There was also lower valuation gains of £12m in Legacy Credit portfolios.
Adjusted ECL were £5m higher compared with 2021, mainly driven by losses in Legacy Credit.
Adjusted operating expenses increased by £51m, largely driven by higher margin on recharges from UK ServCo and higher intercompany recharges from entities in the Group.
Shares of (loss)/profit in associates and joint ventures was a loss of £28m, of which £24m was due to a true-up of prior year valuations in the underlying investments of the BGF. This compared with a profit of £191m in 2021 due to the recovery in asset valuations.
| Dividends |
The consolidated reported profit for the year attributable to the shareholders of the bank was £(408)m.
A special dividend was declared/paid on CET1 capital in 2022.
Further information about the results is given in the consolidated income statement on page 114.
| Review of business position |
| Summary consolidated balance sheet at 31 Dec |
||
|
|
2022 |
2021 |
|
|
£m |
£m |
| Total assets |
717,353 |
596,611 |
| - cash and balances at central banks |
131,433 |
108,482 |
| - trading assets |
79,878 |
83,706 |
| - financial assets designated and otherwise mandatorily measured at fair value through profit or loss |
15,881 |
18,649 |
| - derivatives |
225,238 |
141,221 |
| - loans and advances to banks |
17,109 |
10,784 |
| - loans and advances to customers |
72,614 |
91,177 |
| - reverse repurchase agreements - non-trading |
53,949 |
54,448 |
| - financial investments |
32,604 |
41,300 |
| - assets held for sale |
21,214 |
9 |
| - other assets |
67,433 |
46,835 |
| Total liabilities |
693,337 |
572,896 |
| - deposits by banks |
20,836 |
32,188 |
| - customer accounts |
215,948 |
205,241 |
| - repurchase agreements - non-trading |
32,901 |
27,259 |
| - trading liabilities |
41,265 |
46,433 |
| - financial liabilities designated at fair value |
27,287 |
33,608 |
| - derivatives |
218,867 |
139,368 |
| - debt securities in issue |
7,268 |
9,428 |
| - liabilities of disposal groups held for sale |
24,711 |
- |
| - liabilities under insurance contracts |
19,987 |
22,264 |
| - other liabilities |
84,267 |
57,107 |
| Total equity |
24,016 |
23,715 |
| Total shareholders' equity |
23,875 |
23,584 |
| Non-controlling interests |
141 |
131 |
Total reported assets were 20.2% higher than at 31 December 2021. The group maintained a strong and liquid balance sheet with the ratio of customer advances to customer accounts decreasing to 33.6% from 44.4% as at 31 December 2021 driven by reclassification of French retail loans following the announcement of the sale to assets held for sale as well as ongoing loan book optimisation efforts.
Assets
Cash and balances at central banks increased by 21.2% as a result of increased customer deposits and decreased balances in reverse repos and advances to customers.
Trading assets and financial assets designated at fair value slightly reduced due to a reduction in Prime business and GDM activities on the basis of market conditions in 2022.
Derivative assets increased by 59.5% due to market movements in interest rates and FX rates.
Non-trading reverse repos decreased by 0.9% primarily due to changes in market conditions.
Financial investments decreased by 21.1% as a result of optimisation strategy.
Liabilities
Customer accounts increased by 5.2%, which is consistent with our funding strategy to grow customer deposits and increase stable funding.
Total of trading liabilities and financial liabilities designated at fair value balances has decreased by 14.4%.
Debt securities in issue decreased by 22.9% in line with the funding strategy.
Non-trading repos increased by 20.7% as a result of market activities.
Derivative liabilities increased by 57.0%. This is in line with derivative assets as the underlying risk is broadly matched.
Equity
Total shareholder's equity remained broadly unchanged as compared to 2021.
| Net interest margin |
Net interest margin is calculated by dividing net interest income as reported in the income statement by the average balance of interest-earning assets. Average balances are based on daily averages of the group's activities.
| Net interest income |
|||
|
|
2022 |
2021 |
2020 |
|
|
£m |
£m |
£m |
| Interest income |
6,535 |
3,149 |
4,086 |
| Interest expense |
(4,631) |
(1,395) |
(2,188) |
| Net interest income |
1,904 |
1,754 |
1,898 |
| Average interest-earning assets |
372,159 |
354,324 |
369,617 |
|
|
% |
% |
% |
| Gross interest yield1 |
1.53 |
0.51 |
0.74 |
| Less: gross interest payable1 |
(1.23) |
(0.01) |
(0.27) |
| Net interest spread2 |
0.30 |
0.50 |
0.47 |
| Net interest margin3 |
0.51 |
0.50 |
0.51 |
1 Gross interest yield is the average annualised interest rate earned on average interest-earning assets ('AIEA'). Gross interest payable is the average annualised interest cost as a percentage of average interest-bearing liabilities.
2 Net interest spread is the difference between the average annualised interest rate earned on AIEA, net of amortised premiums and loan fees, and the average annualised interest rate payable on average interest-bearing liabilities.
3 Net interest margin is net interest income expressed as an annualised percentage of AIEA.
| Summary of interest income by asset type |
|||||||||
|
|
2022 |
2021 |
2020 |
||||||
|
|
Average |
Interest |
Yield1 |
Average |
Interest |
Yield1 |
Average |
Interest |
Yield1 |
|
|
£m |
£m |
% |
£m |
£m |
% |
£m |
£m |
% |
| Short term funds and loans and advances to banks |
144,826 |
1,115 |
0.77 |
119,025 |
(221) |
(0.19) |
90,841 |
(113) |
(0.12) |
| Loans and advances to customers |
91,882 |
2,177 |
2.37 |
99,151 |
1,585 |
1.60 |
116,518 |
2,058 |
1.77 |
| Reverse repurchase agreements - non-trading |
56,144 |
1,099 |
1.96 |
57,630 |
(132) |
(0.23) |
68,573 |
22 |
0.03 |
| Financial investments |
37,949 |
633 |
1.67 |
45,142 |
497 |
1.10 |
51,335 |
652 |
1.27 |
| Other interest-earning assets |
41,358 |
686 |
1.66 |
33,376 |
67 |
0.20 |
42,350 |
118 |
0.28 |
| Total interest-earning assets |
372,159 |
5,710 |
1.53 |
354,324 |
1,796 |
0.51 |
369,617 |
2,737 |
0.74 |
1 Interest yield calculations include negative interest on assets recognised as interest expense in the income statement.
| Summary of interest expense by type of liability and equity |
|||||||||
|
|
2022 |
2021 |
2020 |
||||||
|
|
Average |
Interest |
Cost1 |
Average |
Interest |
Cost1 |
Average |
Interest |
Cost1 |
|
|
£m |
£m |
% |
£m |
£m |
% |
£m |
£m |
% |
| Deposits by banks |
31,930 |
55 |
0.17 |
32,891 |
(186) |
(0.57) |
28,812 |
(60) |
(0.21) |
| Customer accounts |
164,681 |
1,742 |
1.06 |
150,048 |
95 |
0.06 |
143,807 |
321 |
0.22 |
| Repurchase agreements - non-trading |
31,898 |
680 |
2.13 |
32,916 |
(192) |
(0.58) |
38,829 |
(129) |
(0.33) |
| Debt securities in issue - non-trading |
29,385 |
589 |
2.00 |
38,727 |
258 |
0.67 |
52,781 |
546 |
1.03 |
| Other interest-bearing liabilities |
50,301 |
739 |
1.47 |
36,811 |
68 |
0.18 |
47,384 |
160 |
0.34 |
| Total interest-bearing liabilities |
308,195 |
3,805 |
1.23 |
291,393 |
43 |
0.01 |
311,613 |
838 |
0.27 |
1 Interest payable calculations include negative interest on liabilities recognised as interest income in the income statement.
| Reconciliation of alternative performance measures |
Return on average ordinary shareholders' equity and return on average tangible equity
Return on average ordinary shareholders' equity ('RoE') is computed by taking profit attributable to the ordinary shareholders of the parent company ('reported results'), divided by average ordinary shareholders' equity ('reported equity') for the period. The adjustment to reported results and reported equity excludes amounts attributable to non-controlling interests and holders of preference shares and other equity instruments.
Return on average tangible equity ('RoTE') is computed by adjusting reported results for the movements in the present value of in-force long-term insurance business ('PVIF') and for impairment of goodwill and other intangible assets (net of tax), divided by average reported equity adjusted for goodwill, intangibles and PVIF for the period.
RoTE excluding significant items is annualised profit attributable to ordinary shareholders, excluding changes in PVIF, significant items and bank levy (net of tax), divided by average tangible shareholders' equity excluding fair value of own debt, DVA and other adjustments for the period.
We provide RoTE ratio in addition to RoE as a way of assessing our performance, which is closely aligned to our capital position.
| Return on average ordinary shareholders' equity and return on average tangible equity |
|||
|
|
Year ended |
||
|
|
31 Dec |
31 Dec |
31 Dec |
|
|
2022 |
2021 |
2020 |
|
|
£m |
£m |
£m |
| Profit |
|
|
|
| Profit attributable to the ordinary shareholders of the parent company |
(611) |
847 |
(1,643) |
| Decrease/(increase) in PVIF (net of tax) |
(105) |
(149) |
59 |
| Profit attributable to the ordinary shareholders, excluding other intangible assets impairment and PVIF |
(716) |
698 |
(1,584) |
| Significant items (net of tax) |
1,753 |
468 |
1,050 |
| Profit attributable to the ordinary shareholders, excluding PVIF and significant items |
1,037 |
1,166 |
(534) |
| Equity |
|
|
|
| Average total shareholders' equity |
23,550 |
23,629 |
24,457 |
| Effect of average preference shares and other equity instruments |
(3,888) |
(3,722) |
(3,722) |
| Average ordinary shareholders' equity |
19,662 |
19,907 |
20,735 |
| Effect of PVIF (net of tax) |
(727) |
(553) |
(464) |
| Significant items and other adjustments (net of tax) |
(240) |
(92) |
(733) |
| Average tangible equity excluding PVIF, significant items and other adjustments |
18,695 |
19,262 |
19,538 |
| Ratio |
|
|
|
| Return on average ordinary shareholders' equity (annualised) |
(3.1) |
4.3 |
(7.9) |
| Return on average tangible equity (annualised) |
(3.8) |
3.6 |
(8.1) |
| Adjusted Return on average tangible equity (annualised) |
5.5 |
6.1 |
(2.7) |
| Risk overview |
The group continuously identifies, assesses, manages and monitors risks. This process, which is informed by its risk factors and the results of its stress testing programme, gives rise to the classification of certain financial and non-financial risks. Changes in the assessment of these risks may result in adjustments to the group's business strategy and, potentially, its risk appetite.
Our banking risks include credit risk, treasury risk, market risk, climate risk, resilience risk, regulatory compliance risk, financial crime and fraud risk and model risk. We also incur insurance risk.
In addition to these banking risks, we have identified top and emerging risks with the potential to have a material impact on our financial results, our reputation and the sustainability of our long-term business model.
The exposure to our risks and risk management of these are explained in more detail in the Risk section of the Report of the Directors on pages 26 to 93.
We have reviewed our list of top and emerging risks and changed the title of 'Regulatory focus on conduct of business' risk to 'Evolving regulatory environment' risk to reflect the broad regulatory agenda, including conduct. Credit risk has been added to reflect the current economic environment.
| |
|
|
| Externally driven |
||
| Geopolitical and macroeconomic risk |
p |
Our operations and portfolios are exposed to risks associated with political instability, civil unrest and military conflict, which could lead to disruption of our operations, physical risk to our staff and/or physical damage to our assets. Heightened geopolitical tensions including the ongoing Russia-Ukraine war, alongside the economic impacts that continue to result from the Covid-19 pandemic, have also disrupted supply chains globally. These events and rising inflation in the European region have created a marked economic slowdown which will affect our customers and our business. |
| Credit risk |
● |
We regularly undertake detailed reviews of our portfolios and proactively manage credit facilities to customers and sectors likely to come under stress as a result of current macroeconomic and geopolitical events including the Russia-Ukraine war and the recessionary pressures across Europe. Particular emphasis has been maintained on the Real Estate, Construction and Contracting, Retail and Leverage portfolios. We have increased the frequency and depth of our monitoring activities with stress tests and other sectoral reviews performed to identify portfolios or customers who are likely to experience financial difficulty through the slowdown in economic activity. |
| Cyber threat and unauthorised access to systems |
u |
We face a risk of service disruption from external and internal malicious activity. In response to the recent geopolitical events, we have further strengthened our monitoring approach. We operate a continuous improvement programme to protect our technology operations, and to counter a fast evolving cyber threat environment. |
| Evolving regulatory environment risk |
u |
The compliance risk environment remains complex, given heightened geopolitical tensions and consequent macroeconomic impacts. There remains increased regulatory focus on operational and cyber resilience, economic impacts (including on customers), crypto-asset-related risks and sanctions, and wider anti-money laundering controls. These, alongside an increased focus on how financial services organisations demonstrate active management of and compliance with regulatory obligations and wider expectations, may result in change requirements across the group in the short to medium term. We continue to monitor regulatory and wider industry developments closely and engage with regulators as appropriate. |
| Financial crime and fraud risk |
p |
We continue to support our customers against a backdrop of complex geopolitical, socio-economic and technological challenges, including the Russia-Ukraine war. We are monitoring the impacts of the Russia-Ukraine war on the group, and using our sanctions compliance capabilities to respond to evolving sanctions regulations, noting the challenges that arise in implementing the unprecedented volume and diverse set of sanctions and trade restrictions. |
| Ibor transition |
q |
We remain exposed to regulatory compliance, legal and resilience risks as contracts transition away from demising Ibor benchmarks to new reference rates. As a result, we continue to consider the fairness of client outcomes, our compliance with regulatory expectations and the operation of our systems and processes. The key risks are diminishing in line with our process implementation as we have transitioned all but a small number of contracts in demised Ibors, and are well progressed in transitioning contracts in remaining demising Ibors, specifically US dollar Libor. |
| Environmental, social and governance risk |
p |
We are subject to ESG risks relating to climate change, greenwashing, nature and human rights. This risk has increased owing to the pace and volume of regulatory developments globally and stakeholders placing more emphasis on financial institutions' actions and investment decisions in respect of ESG matters. Failure to meet these evolving expectations may result in financial and non-financial risks for the group, including adverse reputational consequences. |
|
|
|
|
| |
|
|
| Internally driven |
||
| People risk |
p |
We monitor workforce capacity and capability requirements in line with our published growth strategy, in conjunction with risks related to employment relations practices, culture, and conduct. People risk has heightened in 2022 compared to 2021, mainly resulting from the many transformation and restructuring activities concomitantly happening in the region. The main risk drivers the region is exposed to are capacity and capability risks associated with talent attraction and retention, coupled with the effects of the current geopolitical tensions on our employees and markets' economies. Strong oversight continues to be maintained over people risks arising from change activity. Measures are being rolled out to support our people while transitioning to new business models as well as with challenges resulting from the current heightened inflationary pressures. |
| IT systems infrastructure and operational resilience |
p |
We continue to monitor and improve our IT systems and network resilience, both on our premises and on the Cloud to minimise service disruption and improve customer experience. To support the business strategy, we strengthened our end to end management, build and deployment controls and system monitoring capabilities. We are seeing increased demand on customer support centres and our business operations as a result of the current economic environment and there is additional focus on our operational resilience. We continue to seek to reduce the complexity of our technology estate and consolidate our core banking systems onto a single strategic platform. |
| Execution risk |
p |
Failure to effectively prioritise, manage and/or deliver transformation within the group impacts our ability to achieve our strategic objectives. Given the scale, complexity and pace of strategic change within the group, we must monitor, manage and oversee change execution risk to make sure our change portfolio and initiatives continue to deliver the right outcomes for our customers, people, regulators, investors and communities. |
| Model risk |
u |
Evolving regulatory requirements are driving material changes to the way model risk is managed across the banking industry, with particular focus on capital models. New technologies such as machine learning are driving changes to the model landscape, and the group's strategic focus on climate risk requires the development of new methods that will effectively model climate-related factors and activities. A key area of focus is ensuring our standards, processes and controls are adequate to identify, measure and manage the resulting model risks. New Bank of England guidance on model risk management will require greater focus on the management of model risks across the bank. |
| Data risk |
p |
We use data to serve our customers and run our operations, often in real-time within digital experiences and processes. If our data is not accurate and timely, our ability to serve customers, operate with resilience or meet regulatory requirements could be impacted. We need to ensure that data is kept confidential, and that we comply with the growing number of laws and increasing expectations from regulators concerning data privacy controls and the cross-border movement of data. |
| Third party risk |
u |
We procure services and goods from a range of third parties. It is critical that we have appropriate risk management policies and processes over the selection and governance of third parties. This includes third parties' supply networks, particularly for key activities that could affect our operational resilience. Any deficiency in the management of risks associated with our third parties could affect our ability to support our customers and meet regulatory expectations. |
| ● |
New risk introduced in 2022 |
| p |
Risk has heightened during 2022 |
| u |
Risk remains at the same level as 2021 |
| q |
Risk has decreased during 2022 |
On behalf of the Board
David Watts
Director
20 February 2023
Registered number 00014259
| Risk |
|
|
|
Page |
| Our approach to risk |
26 |
| Our risk appetite |
26 |
| Risk management |
28 |
| Key developments and risk profile |
28 |
| Top and emerging risks |
28 |
| Externally driven |
29 |
| Internally driven |
33 |
| Our material banking and insurance risks |
35 |
| Credit risk |
37 |
| Treasury risk |
78 |
| Market risk |
88 |
| Climate risk |
92 |
| Resilience risk |
93 |
| Regulatory compliance risk |
93 |
| Financial crime risk |
95 |
| Model risk |
96 |
| Insurance manufacturing operations risk Overview |
97 |
.
| Our approach to risk |
Our risk appetite
We recognise the importance of a strong risk culture, which refers to our shared attitudes, values and standards that shape behaviours related to risk awareness, risk taking and risk management. All our people are responsible for the management of risk, with the ultimate accountability residing with the Board.
We seek to build our business for the long term by balancing social, environmental and economic considerations in the decisions we make. Our strategic priorities are underpinned by our endeavour to operate in a sustainable way. This helps us to carry out our social responsibility and manage the risk profile of the business. We are committed to managing and mitigating climate-related risks, both physical and transition, and continue to incorporate consideration of these into how we manage and oversee risks internally and with our customers.
The following principles guide the group's overarching appetite for risk and determine how our businesses and risks are managed.
Financial position
• Strong capital position, defined by regulatory and internal ratios.
• Liquidity and funding management for each entity on a stand-alone basis.
Operating model
• Ambition to generate returns in line with our risk appetite and strong risk management capability.
• Ambition to deliver sustainable earnings and appropriate returns for shareholders.
Business practice
• Zero tolerance for knowingly engaging in any business, activity or association where foreseeable reputational risk or damage has not been considered and/or mitigated.
• No appetite for deliberately or knowingly causing detriment to consumers arising from our products and services or incurring a breach of the letter or spirit of regulatory requirements.
• No appetite for inappropriate market conduct by a member of staff or by any group business.
Enterprise-wide application
Our risk appetite encapsulates the consideration of financial and non-financial risks. We define financial risk as the risk of a financial loss as a result of business activities. We actively take these types of risks to maximise shareholder value and profits.
Non-financial risk is defined as the risk to achieving our strategy or objectives as a result of inadequate or failed internal processes, people and systems, or from external events.
Our Risk Management Framework
An established risk governance framework and ownership structure ensures oversight of, and accountability for, the effective management of risk within the group. HSBC's Risk Management Framework ('RMF') fosters the continuous monitoring of the risk environment and an integrated evaluation of risks and their interactions. Integral to the RMF are risk appetite, stress testing and the identification of emerging risks.
Our Risk Committee focuses on risk governance and ensures a forward-looking view of risks and their mitigation. The Risk Committee is a committee of the Board and has responsibility for oversight and advice to the Board on, amongst other things, the bank's risk appetite, tolerance and strategy, systems of risk management, internal control and compliance. Additionally, members of the Risk Committee attend meetings of the bank's Nomination, Remuneration and Governance Committee at which the alignment of the reward structures to risk appetite is considered.
In carrying out its responsibilities, the Risk Committee is closely supported by the Chief Risk Officer, the Chief Financial Officer, the Head of Internal Audit and the Head of Compliance, together with other business functions on risks within their respective areas of responsibility.
Responsibility for managing both financial and non-financial risk lies with our people. They are required to manage the risks of the business and operational activities for which they are responsible. We maintain oversight of our risks through our various specialist Risk Stewards, as well as the accountability held by the Chief Risk Officer.
Non-financial risk includes some of the most material risks HSBC faces, such as cyber-attacks, poor customer outcomes and loss of data and the current geopolitical risks. Actively managing non-financial risks is crucial to serving our customers effectively and having a positive impact on society. During 2022 we continued to strengthen the control environment and our approach to the management of non-financial risks, as is broadly set out in our Risk Management Framework. The management of non-financial risk focuses on governance and risk appetite, providing a single view of the non-financial risks that matter most, and associated controls. It incorporates a risk management system designed to enable the active management of non-financial risk. Our ongoing focus is on simplifying our approach to non-financial risk management, while driving more effective oversight and better end-to-end identification and management of non-financial risks. This is overseen by the Operational and Resilience Risk function, headed by the group Head of Operational and Resilience Risk.
Three lines of defence
All our people are responsible for identifying and managing risk within the scope of their roles. Roles are defined using the three lines of defence model, which takes into account our business and functional structures.
To create a robust control environment to manage risks, we use an activity-based three lines of defence model, whereby the activity a member of staff undertakes drives which line they reside within. This model delineates management accountabilities and responsibilities for risk management and the control environment.
The model underpins our approach to risk management by clarifying responsibility, encouraging collaboration and enabling efficient coordination of risk and control activities. The three lines are summarised below:
• The first line of defence owns the risks and is responsible for identifying, recording, reporting and managing them in line with risk appetite, and ensuring that the right controls and assessments are in place to mitigate them.
• The second line of defence challenges the first line of defence on effective risk management, and provides advice and guidance in relation to the risk.
• The third line of defence is our Internal Audit function, which provides independent assurance that the group's risk management approach and processes are designed and operating effectively.
Risk appetite
We formally articulate our risk appetite through our risk appetite statement ('RAS'), which is approved by the Board on the recommendation of the Risk Committee. Setting out our risk appetite ensures that planned business activities provide an appropriate balance of return for the risk we are taking, and that we agree a suitable level of risk for our strategy. In this way, risk appetite informs our financial planning process and helps senior management to allocate capital to business activities, services and products.
The RAS consists of qualitative statements and quantitative metrics, covering financial and non-financial risks. It is fundamental to the development of business line strategies, strategic and business planning and senior management balanced scorecards. Performance against the RAS is reported to the Risk Management Meeting ('RMM') so that any actual performance that falls outside the approved risk appetite is discussed and appropriate mitigating actions are determined. This reporting allows risks to be promptly identified and mitigated, and informs risk-adjusted remuneration to drive a strong risk culture.
| Risk management |
Stress testing
Stress testing is an important tool that is used by banks, as part of their internal risk management, and regulators to assess vulnerabilities in individual banks and/or the financial banking sector under hypothetical adverse scenarios. The results of stress testing are used to assess banks' resilience to a range of adverse shocks and to assess their capital adequacy.
HSBC Bank plc is subject to regulatory stress testing in several jurisdictions. These requirements are increasing in frequency and granularity. They include the programmes of the BoE, Prudential Regulation Authority ('PRA') and the European Banking Authority ('EBA'). Assessment by regulators is on both a quantitative and qualitative basis, the latter focusing on our portfolio quality, data provision, stress testing capability and capital planning processes.
A number of internal macroeconomic and event-driven scenarios specific to the European region were considered and reported to senior management during the course of the year. The selection of stress scenarios is based upon the output of our top and emerging risks identified and our risk appetite. The results help the Board and senior management to set our risk appetite and confirm the strength of our strategic and financial plans. Our risk appetite is set at a level that enables the group to withstand future stress impacts.
The macroeconomic internal stress tests, conducted throughout 2022, considered combinations of various potential impacts as identified in our top and emerging risks, in particular the impact of the Russia-Ukraine war, geopolitical tensions and trade wars, and operational risk.
In Q4 2022, the Group participated in the BoE Annual Cyclical Scenario ('ACS') stress testing exercise. The ACS focused on higher global interest rates in the face of a series of global cost shocks and high and persistent global inflation. Unemployment, also increased sharply. The impact of traded risk shocks was included, linked to a financial market scenario consistent with the content and calibration of the macroeconomic scenario.
This stress scenario was more severe than the Global Financial Crisis for both the UK and the world.
The scenario reflected the impact of weaker household real income growth, lower confidence and tighter financial conditions resulting in severe domestic and global recessions.
The BoE will publish the results in summer 2023.
In response to regulatory requirements and internal drivers, separately to the stress tests already mentioned, we are developing our capabilities to model the impact of climate risk on our bank, specifically physical and transition risk.
In 2022, we have considered four bespoke scenarios that were designed to articulate our view of the range of potential outcomes for global climate change. In our climate scenario analysis, we consider, separately: transition risk arising from the process of moving to a net zero economy, including changes in policy, technology, consumer behaviour and stakeholder perception, which will each impact borrowers' operating income, financing requirements and asset values; and physical risk arising from the increased frequency and severity of weather events, such as hurricanes and floods, or chronic shifts in weather patterns, which will each impact property values, repair costs and lead to business interruptions.
These scenarios, which reflect different levels of physical and transition risk and are varied by severity and probability, were: the Net Zero scenario, which aligns with the Group net zero strategy and is consistent with the Paris Agreement; the Current Commitments scenario, which assumes that climate action is limited to the current governmental commitments and pledges; the Downside Transition Risk scenario, which assumes that climate action is delayed until 2030; and the Downside Physical Risk scenario, which assumes climate action is limited to current governmental policies.
We consider our Current Commitments scenario as the most likely scenario to transpire over the next five years. Under the Current Commitments scenario, we expect moderate levels of losses relating to transition risks. However, the rise in global warming will lead to increasing levels of physical risk losses in later years. Based on this scenario the potential impact on expected credit losses is not considered material over the next five years, as the impacts of climate risk will emerge later in the following decades.
| Key developments and risk profile |
Key developments in 2022
We actively managed the risks related to the Russia-Ukraine war and broader macroeconomic and geopolitical uncertainties, as well as other key risks described in this section.
In addition, we enhanced our risk management in the following areas:
• We have continued to improve our risk governance decision making, particularly with regard to the governance of treasury risk to ensure senior executives have appropriate oversight and visibility of macroeconomic trends around inflation and interest rates.
• We enhanced our enterprise risk reporting processes to place a greater focus on our emerging risks, including by capturing the materiality, oversight and individual monitoring of these risks.
• We have further strengthened our third-party risk policy and processes to improve control and oversight of our material third parties that are key to maintaining our operational resilience, and to meet new and evolving regulatory requirements.
• We have continued to embed, the governance and oversight around model adjustments, related processes for IFRS 9 models and financial reporting processes.
• Through our climate risk programme we have continued to embed climate considerations throughout the firm, including updating the scope of our programme to cover all risk types, expanding the scope of climate related training and developing new climate risk metrics to monitor and manage exposures.
• We continued to improve the effectiveness of our financial crime controls, deploying advanced analytics capabilities into our markets. We are refreshing our financial crime policies, ensuring they remain up-to-date and address changing and emerging risks. We continue to monitor regulatory changes.
| Top and emerging risks |
We use a top and emerging risks process to provide a forward-looking view of issues with the potential to threaten the execution of our strategy or operations over the medium to long term.
We proactively assess the internal and external risk environment, as well as review the themes identified across the European region and the group's businesses, for any risks that may require escalation. We update our top and emerging risks as necessary.
Our current top and emerging risks are as follows.
Externally driven
Geopolitical and macroeconomic risk
The Russia-Ukraine war has had far-reaching geopolitical and economic implications. The group is monitoring the impacts of the war and continues to respond to the further economic sanctions and trade restrictions that have been imposed on Russia in response. In particular, significant sanctions and trade restrictions against Russia have been put in place by the US, the UK and the EU, as well as other countries. Such sanctions and restrictions have specifically targeted certain Russian government officials, politically exposed persons, business people, Russian oil imports, energy products, financial institutions and other major Russian companies, as well as more generally applicable investment, export, and import bans and restrictions. In response to such sanctions and trade restrictions, as well as asset flight, Russia has implemented certain countermeasures. Further sanctions, trade restrictions and Russian counter sanctions may adversely affect the group, its customers and the markets in which we operate by creating regulatory, reputational and market risks.
Our business in Russia principally serves multinational corporate clients headquartered in other countries, is not accepting new business or customers, and is consequently on a declining trend. Following a strategic review, HSBC Europe BV (a wholly-owned subsidiary of HSBC Bank plc) has entered into an agreement to sell its wholly-owned subsidiary HSBC Bank (RR) (Limited Liability Company), subject to regulatory and governmental approvals.
Global commodity markets have been significantly impacted by the Russia-Ukraine war and localised Covid-19 outbreaks, leading to continued supply chain disruptions. This has resulted in European product shortages and increased prices for both energy and non-energy commodities, such as food. Despite falls in wholesale energy prices in late 2022 and early 2023, which may provide relief, ongoing pass-through of input price rises means we do not expect underlying inflationary pressures to ease significantly in the near term. These issues have exacerbated inflation across the region. Prolonged spells of relatively mild seasonal weather, and diversification of fuel services have nevertheless helped Europe to substantially reduce risks of energy rationing over the winter months.
Rising global inflation has prompted the ECB to tighten monetary policy. The combined pressure of inflation and interest rate rises may lead to pressures on customers and their ability to repay debt. The ECB has increased its benchmark rate by 300bps since July 2022. Further interest rate increases by the ECB are anticipated in light of inflation forecasts. Investors appear less willing to tolerate expansionary fiscal policies in the context of high debt ratios. An economic slowdown, possibly a recession in parts of the EU and the UK, could slow the pace of tightening in our major markets. However, should interest rates need to rise beyond what is currently expected, a realignment of market expectations could cause turbulence in financial asset prices.
Second order impacts from the Russia-Ukraine war and other geopolitical events remain uncertain and may lead to significant credit losses on specific exposures, which may not be fully captured in our ECL estimates. Higher inflationary concerns and interest rate expectations across the region are also having an impact on ECL. In line with existing practice we have continued to carry out enhanced monitoring of model outputs and the use of model overlays, including management adjustments based on the expert judgement of senior credit risk managers to reflect current market inflation and interest rate conditions where they have not been incorporated in the underlying macroeconomic scenarios. Inflation and rising interest rates have been considered both directly in certain models, and assessed via adjustments where not directly considered.
Whilst many of the government programmes implemented during the Covid-19 pandemic to support businesses and individuals have ceased, these have impacted the level of credit losses, which in turn may have impacted the longer-term reliability of loss and capital models.
Negotiations between the UK and the EU over the operation of the Northern Ireland Protocol are continuing. While there are signs that differences may be diminishing, failure to reach agreement could have implications for the future operation of the EU-UK TCA. In June 2022, the UK government published proposed legislation that seeks to amend the Protocol in a number of respects. In response, the EU launched infringement procedures against the UK, and is evaluating the UK response, received in September 2022. If the proposed legislation were to pass, and infringement procedures progressed, it could further complicate the terms of trade between the UK and the EU and potentially prevent progress in other areas such as financial services. We are monitoring the situation closely, including the potential impacts on our customers.
Our business could also be adversely affected by economic or political developments in regions of the world outside Europe. This reflects our extensive business links, through members of the Group and other entities, in Asia and elsewhere. Tensions between China and the US, extending to the UK, the EU, India and other countries, and political developments in Hong Kong and Taiwan, may adversely affect the group.
The US, the UK, the EU and other countries have imposed various sanctions and trade restrictions on China. In response to foreign sanctions and trade restrictions, China has also announced sanctions, trade restrictions and laws that could impact the group and its customers.
High Covid-19 vaccination rates and acquired population immunity in 2022 across the European region have reduced the public health risks and the need for restrictions. New Covid-19 variants and sub-variants pose a continuing risk and could result in the European governments reintroducing restrictions, potentially impacting our personal and business customers.
Our Central macroeconomic scenario, which has the highest probability weighting in our IFRS 9 'Financial Instruments' calculations of ECL, assumes low growth and a higher inflation environment. However, due to the rapidly changing economic conditions, the potential for forecast dispersion and volatility remain high, impacting the degree of accuracy and certainty of our Central scenario forecast. The level of volatility depends on various factors, including but not limited to: commodity price increases, supply chain constraints and the monetary policy response to inflation. There is also uncertainty with respect to the relationship between the economic drivers and the historical loss experience, which has required adjustments to modelled ECLs in cases where we determined that the model was unable to capture the material underlying risks. For further details of our Central and other scenarios, see 'Measurement uncertainty and sensitivity analysis of ECL estimates' on page 48.
Mitigating actions
• We closely monitor geopolitical and economic developments including the impacts of the Russia-Ukraine war and undertake scenario analysis and stress testing where appropriate. This helps us to take portfolio actions where necessary, including seeking to ensure enhanced monitoring and amending our risk appetite.
• We continue to monitor the EU's relationship with the UK, and assess the potential impact on our people, operations and portfolios.
• We continue to monitor our risk profile closely in the context of the current geopolitical and macroeconomic situation, and given the significant uncertainties, additional mitigating actions may be required.
Credit risk
Credit risk has increased driven chiefly by the impacts and uncertainty caused by the current geopolitical and macroeconomic environment. Economic prospects and therefore the outlook for credit risk across our key markets will be driven by a number of factors including how inflationary pressures are managed across the EU and the UK, and whether a global recession develops, exacerbated by the ongoing Russia-Ukraine war.
Mitigating actions
• Reviews of key credit portfolios are undertaken regularly to seek to ensure that individual customer or portfolio risks are understood and our management of the level of facilities offered through the economic downturn is appropriate.
• We continue to monitor high risk wholesale industry sectors closely and in 2022 we undertook specific reviews of portfolios showing vulnerability such as Real Estate, Retail, Construction and Contracting and Wholesale Trade.
• Detailed performance monitoring is reviewed on a monthly basis, which includes early warning indicators and a view of concentration risks. Portfolio limits and exposures are re-assessed and reductions implemented where appropriate.
• We stress test portfolios of particular concern to identify sensitivity to loss under a range of scenarios, with management actions being taken to seek to rebalance exposures and to manage risk appetite where necessary.
Cyber threat and unauthorised access to systems
Together with other organisations, we continue to operate in an increasingly hostile cyber threat environment. These threats include potential unauthorised access to customer accounts, attacks on our systems or those of our third-party suppliers and require ongoing investment in business and technical controls to defend against them.
Mitigating actions
• We continuously evaluate threat levels for the most prevalent cyber-attack types and their potential outcomes. To further protect the group and our customers and help ensure the safe expansion of our business lines, we continue to strengthen our controls to reduce the likelihood and impact of advanced malware, data leakage, exposure through third parties and security vulnerabilities.
• We seek to enhance our cybersecurity capabilities, including Cloud security, identity and access management, metrics and data analytics, and third-party security reviews. An important part of our defence strategy is ensuring our colleagues remain aware of cybersecurity issues and know how to report incidents.
• We report and review cyber risk and control effectiveness at executive and non-executive Board level. We also report it across our businesses and functions to help ensure appropriate visibility and governance of the risk and its mitigating actions.
• We participate globally in industry bodies and working groups to collaborate on tactics employed by cyber-crime groups and to collaborate in defending, detecting and preventing cyber-attacks on financial organisations.
Evolving regulatory environment risk
We aim to keep abreast of the emerging regulatory compliance and conduct agenda, which currently includes, but is not limited to: ESG matters; ensuring good customer outcomes; addressing customer vulnerabilities due to cost of living pressures; regulatory compliance; regulatory reporting; employee compliance, including use of e-communication channels; and the proposed reforms to the UK financial services sector, known as the Edinburgh Reforms.
We monitor regulatory developments closely and engage with regulators, as appropriate, to help ensure new regulatory requirements are implemented effectively and in a timely way.
The competitive landscape in which the group operates may be impacted by future regulatory changes and government intervention.
Mitigating actions
• We monitor for regulatory developments to understand the evolving regulatory landscape and seek to respond with changes in a timely way.
• We continue to support work that is focussed on the implementation of UK Consumer Duty requirements.
• We engage with governments and regulators to make a contribution to regulations and to try and ensure that new requirements are considered properly and can be implemented effectively. We hold regular meetings with relevant authorities to discuss strategic contingency plans, including those arising from geopolitical issues.
• Our simplified conduct approach has been embedded to align to our purpose and values, in particular the value 'we take responsibility'.
Financial crime and fraud risk
Financial institutions remain under considerable regulatory scrutiny regarding their ability to detect and prevent financial crime, which continues to evolve. Challenges include managing conflicting laws and approaches to legal and regulatory regimes, and implementing the unprecedented volume and diverse set of sanctions, notably as a result of the Russia-Ukraine war.
Amid rising inflation and increasing cost of living pressures, we face increasing regulatory expectations with respect to increases in internal and external fraud and the abuse of vulnerable customers for financial crime.
The digitisation of financial services continues to have an impact on the payments ecosystem, with an increasing number of market entrants and payment mechanisms, not all of which are subject to the same level of regulatory scrutiny or regulations as financial institutions. This presents ongoing challenges in terms of maintaining required levels of payment transparency, notably where financial institutions serve as intermediaries. Developments around digital assets and currencies have continued at pace, with an increasing regulatory and enforcement focus on the financial crimes linked to these types of assets.
Expectations with respect to the intersection of ESG issues and financial crime as our organisation, customers and suppliers transition to net zero, continue to increase, focussed on potential 'greenwashing,' human rights issues and environmental crimes.
We also continue to face increasing challenges presented by national data privacy requirements, which may affect our ability to manage financial crime risks holistically and effectively.
Mitigating actions
• We continue to manage sanctions and trade restrictions through the use of, and enhancements to, our existing controls.
• We continue to develop our fraud controls, and invest in capabilities to fight financial crime through the application of advanced analytics and artificial intelligence.
• We are looking at the impact of a rapidly changing payments ecosystem, as well as risks associated with direct and indirect exposure to digital assets and currencies, in an effort to ensure our financial crime controls remain appropriate.
• We are assessing our existing policies and control framework so that developments relating to the ESG space are considered and the risks mitigated.
• We engage with regulators, policymakers and relevant international bodies, seeking to address data privacy challenges through international standards, guidance and legislation.
Ibor transition
Interbank offered rates ('Ibors') have previously been used extensively to set interest rates on different types of financial transactions and for valuation purposes, risk measurement and performance benchmarking.
Following the UK's Financial Conduct Authority ('FCA') announcement in July 2017 that it would no longer continue to persuade or require panel banks to submit rates for the London interbank offered rate ('Libor') after 2021, we have been actively working to transition legacy contracts from Ibors to products linked to near risk-free replacement rates ('RFRs') or alternative reference rates.
The publication of sterling, Swiss franc, euro and Japanese yen Libor interest rate benchmarks, as well as Euro Overnight Index Average ('Eonia'), ceased from the end of 2021. The group's Ibor transition programme, which is tasked with the development of RFR products and the transition of legacy Ibor products, has continued to support the transition of a limited number of remaining contracts in sterling and Japanese yen Libor, which were published using a 'synthetic' interest rate methodology during 2022. The remaining 'tough legacy' sterling contracts have required protracted client discussions where contracts are complex or restructuring of facilities is required. Following the cessation of publication of 'synthetic' Japanese yen Libor after 31 December 2022, and the announcements by the FCA, in September and November 2022, that 'synthetic' sterling Libor rates will cease to be published on 31 March 2023 for one and six- month sterling Libor, or 31 March 2024 for three-month sterling Libor, we have or are prepared to transition or remediate the remaining few contracts outstanding as at 31 December 2022 in advance of those cessation dates.
For the cessation of the publication of US dollar Libor from 30 June 2023, we have implemented the majority of required processes, technology and RFR product capabilities throughout the group in preparation for upcoming market events and continue to transition outstanding legacy contracts through the first half of 2023. We continue to make steady progress with the transition of the outstanding legacy committed lending facilities. Transition of our derivatives portfolio is progressing well with most clients reliant on industry mechanisms to transition to RFRs. For the limited number of bilateral derivatives trades where an alternative transition path is required client engagement is continuing. For certain products and contracts, including bonds and syndicated loans, we remain reliant on the continued support of agents and third parties, but we continue to progress those contracts requiring transition. We continue to monitor contracts that may be potentially more challenging to transition and may need to rely upon legislative solutions. Additionally, following the FCA's consultation in November 2022 proposing that US dollar Libor is to be published using a 'synthetic' methodology for a defined period, we will continue to work with our clients to support them through the transition of their products if transition is not completed by 30 June 2023.
We remain mindful of the various factors that have an impact on the Ibor remediation strategy for our regulatory capital instruments, including, but not limited to, timescales for cessation of relevant Ibor rates.
We remain committed in seeking to remediate or mitigate relevant risks relating to Ibor-demise, as appropriate, on our outstanding regulatory capital instruments before the relevant calculation dates, which may occur post-cessation of the relevant Ibor rate or rates.
For US dollar Libor and other demising Ibors, we continue to be exposed to, and actively monitor, risks including:
• Regulatory compliance and conduct risks, as the transition of legacy contracts to RFRs or alternative rates, or sales of products referencing RFRs, may not deliver fair client outcomes;
• Resilience and operational risks, as changes to manual and automated processes, made in support of new RFR methodologies, and the transition of large volumes of Ibor contracts may lead to operational issues;
• Legal risk, as issues arising from the use of legislative solutions and from legacy contracts that the group is unable to transition may result in unintended or unfavourable outcomes for clients and market participants, which could potentially increase the risk of disputes;
• Model risk, as there is a risk that changes to our models, to replace Ibor-related data, adversely affect the accuracy of model outputs; and
• Market risk, because as a result of differences in Libor and RFR interest rates, we are exposed to basis risk resulting from the asymmetric adoption of rates across assets, liabilities and products.
While the level of risk is diminishing in line with our process implementation and continued transition of contracts, we will continue to monitor these risks through the remainder of the transition of legacy contracts. Throughout 2023, we continue to be committed to engaging with our clients and investors to seek to complete an orderly transition of contracts that reference the remaining demising Ibors.
Mitigating actions
• The group Ibor transition programme, which is overseen by the group Chief Risk Officer, will continue to deliver IT and operational processes to meet its objectives.
• We carry out extensive training, communication and client engagement to facilitate appropriate selection of new rates and products.
• We have dedicated teams in place to support the transition.
• We have actively transitioned legacy contracts and ceased entering into new contracts based on demised or demising Ibors, other than those allowed under regulatory exemptions, and implemented associated monitoring and controls.
• We assess, monitor and dynamically manage risks arising from Ibor transition, and implement specific mitigating controls when required.
• We continue to actively engage with regulatory and industry bodies to mitigate risks relating to 'tough legacy' contracts.
Financial instruments impacted by Ibor reforms
Interest Rate Benchmark Reform Phase 2, the amendments to IFRS's issued in August 2020, represents the second phase of the IASB's project on the effects of interest rate benchmark reform. The amendments address issues affecting financial statements when changes are made to contractual cash flows and hedging relationships.
Under these amendments, changes made to a financial instrument measured at other than fair value through profit or loss that are economically equivalent and required by interest rate benchmark reform, do not result in the derecognition or a change in the carrying amount of the financial instrument. Instead they require the effective interest rate to be updated to reflect the change in the interest rate benchmark. In addition, hedge accounting will not be discontinued solely because of the replacement of the interest rate benchmark if the hedge meets other hedge accounting criteria.
(Audited)
|
|
Financial instruments yet to transition to alternative benchmarks, by main benchmark3 |
||
|
|
USD Libor |
GBP Libor |
Others1 |
| At 31 Dec 2022 |
£m |
£m |
£m |
| Non-derivative financial assets2 |
|
|
|
| Loans and advances to customers |
4,350 |
83 |
18 |
| Financial investments |
1,072 |
- |
- |
| Others |
554 |
35 |
- |
| Total non-derivative financial assets |
5,976 |
118 |
18 |
| Non-derivative financial liabilities |
|
|
|
| Subordinated liabilities |
1,287 |
- |
- |
| Others |
560 |
- |
- |
| Total non-derivative financial liabilities |
1,847 |
- |
- |
| Derivative notional contract amount |
|
|
|
| Foreign exchange |
6,754 |
- |
- |
| Interest rate |
1,636,679 |
56 |
2,031 |
| Others |
- |
- |
487 |
| Total derivative notional contract amount |
1,643,433 |
56 |
2,518 |
| At 31 Dec 2021 |
|
|
|
| Non-derivative financial assets2 |
|
|
|
| Loans and advances to customers |
5,999 |
2,562 |
26 |
| Financial investments |
1,171 |
140 |
- |
| Others |
693 |
499 |
- |
| Total non-derivative financial assets |
7,863 |
3,201 |
26 |
| Non-derivative financial liabilities2 |
|
|
0 |
| Subordinated liabilities |
1,145 |
- |
- |
| Others |
479 |
181 |
- |
| Total non-derivative financial liabilities |
1,624 |
181 |
- |
| Derivative notional contract amount |
|
|
0 |
| Foreign exchange |
8,288 |
1,568 |
1,080 |
| Interest rate |
1,567,577 |
215,377 |
77,738 |
| Total derivative notional contract amount |
1,575,865 |
216,945 |
78,818 |
1 Comprises financial instruments referencing other significant benchmark rates yet to transition to alternative benchmarks (euro Libor, Swiss franc Libor, Eonia, SOR, THBFIX, MIFOR and Sibor). Announcements were made by regulators during 2022 on the cessation of the Canadian dollar offered rate ('CDOR'), and Mexican Interbank equilibrium interest rate ('TIIE'), which will eventually transition to the Canadian overnight repo rate average ('CORRA'), and a new Mexican overnight fall-back rate, respectively. Therefore, CDOR, and TIIE are also included in Others during the current period.
2 Gross carrying amount excluding allowances for expected credit losses.
The amounts in the above table relate to the group's main operating entities where we have material exposures impacted by Ibor reform, including in the United Kingdom, France and Germany. The amounts provide an indication of the extent of the group's exposure to the Ibor benchmarks that are due to be replaced. Amounts are in respect of financial instruments that:• contractually reference an interest rate benchmark that is planned to transition to an alternative benchmark;
• have a contractual maturity date beyond the date by which the reference interest rate benchmark is expected to cease; and
• are recognised on the group's consolidated balance sheet.
Environmental, social and governance ('ESG') risk
We are subject to financial and non-financial risks associated with ESG related matters. Our current areas of focus are climate risk, nature-related risks and human rights risks. These can impact us both directly and indirectly through our business activities and relationships.
Focus on climate-related risk in particular increased over 2022, owing to the importance, pace and volume of policy development and regulatory changes on climate risk management, stress testing and scenario analysis and disclosures. Climate change can have an impact across HSBC's risk taxonomy through both transition risk, arising from the move to a low-carbon economy, such as through policy, regulatory and technological changes, and physical risk impacts due to increasing severity and/or frequency of severe weather or other climatic events, such as rising sea levels and flooding, which could affect our ability to conduct our day-to-day operations.
Our most material risks in terms of managing climate risk relate to corporate financing within our banking portfolio. We continue to explore and test methodologies for quantifying how climate risks could impact the individual credit profiles of our clients across various sectors.
Our credit risk policy further embeds climate risk considerations into our corporate credit decisions. We are also developing and rolling out a climate risk assessment, also known as the client Transition Engagement Questionnaire, to corporate clients to help determine the level of transition risk exposure which may affect our credit decisioning and helping to ensure that the transition plans are consistent with HSBC Group's targets and commitments.
We also delivered training to select colleagues in the Risk function to raise awareness of how climate risk is likely to impact certain high transition risk sectors and the associated credit risk considerations.
In addition to financial risks arising in our corporate banking portfolio, we could also face increased reputational, legal and regulatory risks as we make progress towards the HSBC Group's net zero ambition, with stakeholders likely to place greater focus on our actions, such as the development of climate-related policies, the HSBC Group's and our disclosures and financing and investment decisions relating to the HSBC Group's ambition.
We will face additional risks if we are perceived to mislead stakeholders regarding our climate strategy, the climate impact of a product or service, or regarding the commitments of our customers. Climate risk may also impact on model risk, as the uncertain impacts of climate change and data and methodology limitations present challenges to creating reliable and accurate model outputs.
We face reporting risk in relation to our climate disclosures, as any data, methodologies and standards we have used may evolve over time in line with market practice, regulation or owing to developments in climate science. While emissions reporting has improved over time, data remains of limited quality and consistency. The use of inconsistent or incomplete data and models could result in suboptimal decision making. Any changes could result in revisions to our internal frameworks and reported data, and could mean that reported figures are not reconcilable or comparable year on year. We may also have to re-evaluate our progress towards the HSBC Group's climate-related targets in future and this could result in reputational, legal and regulatory risks.
There is increasing evidence that a number of nature-related risks beyond climate change, which include risks that can be represented more broadly by impact and dependence on nature, can and will have significant economic impact. These risks arise when the provision of natural services, such as water availability, air quality, and soil quality, is compromised by overpopulation, urban development, natural habitat and ecosystem loss, ecosystem degradation arising from economic activity and other environmental stresses beyond climate change. They can show themselves in various ways, including through macroeconomic, market, credit, reputational, legal and regulatory risks, for both HSBC and our customers. We continue to engage with investors, regulators and customers on nature-related risks to evolve our approach and understand best practice risk mitigation.
Regulation and disclosure requirements in relation to human rights, and to modern slavery in particular, are increasing. Businesses are expected to be transparent about their efforts to identify and respond to the risk of negative human rights impacts arising from their business activities and relationships.
Mitigating actions
• Our product design, management and governance processes have been adapted to help ensure that climate risk factors are effectively and consistently considered. We also aim to enhance our approach to greenwashing risk management.
• We have established a climate risk appetite which helps support the oversight and management of the risks from climate change and supports the business on helping to deliver the HSBC Group's climate ambition in a safe and sustainable way. The metrics implemented include exposure to high risk transition sectors in our wholesale portfolio. We continue to review our risk appetite to try and ensure that it captures the most material climate risks and develop appropriate metrics to measure and monitor these risks.
• We have enhanced and expanded the use of a client Transition Engagement Questionnaire to better understand our exposure to the highest transition risk sectors and we continue to engage with our customers to understand and help support their transition away from high carbon activities.
• We implement HSBC Group's sustainability risk policies as part of its broader reputational risk framework. We focus our policies on sensitive sectors which may have a high adverse impact on people or on the environment and in which we have a significant number of customers. In December 2022, the HSBC Group announced an updated policy covering the broader energy system including upstream oil and gas, oil and gas power generation, coal, hydrogen, renewables and hydropower, nuclear, biomass and energy from waste. In addition, the HSBC Group also expanded on its thermal coal phase-out policy in which the HSBC Group committed not to provide new finance or advisory services for the specific purpose of the conversion of existing coal-to-gas fired power plants or new metallurgical coal mines. We intend to use our relationships to partner with corporate customers to help them transition to cleaner and safer energy alternatives.
• In 2021, the HSBC Group joined several industry working groups dedicated to helping assess, and manage, nature-related risks, such as the Taskforce on Nature-related Financial Disclosure ('TNFD'). We will use these outputs to help assess the availability of internal nature related data, and identify opportunities to enhance our capabilities further.
• In 2022, building on an earlier review which had identified modern slavery and discrimination as priority human rights issues, the HSBC Group conducted a comprehensive review to refresh our salient human rights issues, which are the human rights at risk of the most severe negative impact through our business activities and relationships. The review identified five salient human rights issues, including the right to decent work and the right to equality and freedom from discrimination, amongst others. The HSBC Group incorporated additional human rights elements into its existing procurement processes and supplier code of conduct, we are applying the approach being developed by HSBC Group to inform our own management of this risk.
• Climate stress tests and scenarios are being used to further improve our understanding of our risk exposures for use in risk management and business decision making.
For further details on our approach to climate risk management, see 'Climate risk' on page 86.
Internally driven
People risk
Our success in delivering our strategic priorities and managing the regulatory and legislative environment proactively depends on the development and retention of our leadership and high-performing employees.
The ability to continue to attract, develop and retain talent is primarily impacted by a competitive labour market across the EU and the UK, coupled with heightened inflationary pressures. While challenges resulting from transformation continued in 2022, these are expected to reduce as we progress with programme execution. The current people risk outlook is expected to remain heightened for the first half of 2023.
Mitigating actions
• We seek to promote a diverse and inclusive workforce and provide active support across a wide range of health and wellbeing activities. We continue to build our speak up culture through active campaigns.
• We monitor people risks that have arisen from organisational restructuring. Talent attraction and retention actions are rolled out; focus and emphasis on our strategy, values and purpose are maintained; and improved capacity and enhanced workload management through demand planning review and strengthening are applied.
• We aim to have robust plans in place, driven by senior management, to help mitigate the effect of external factors that may impact our employment practices. Political, legislative, and regulatory challenges are closely monitored to try and minimise the impact on the attraction and retention of talent and key performers.
• We carefully monitor the impact of the rising cost of living across the region. Our fixed pay principles consider the impact of inflation on our employees across the region recognising the pay pressure that exists and the related people risk impact.
• We deploy a Future Skills Curriculum to all employees through the HSBC University to help provide skills that will enable employees and HSBC to be successful in the future.
• We continue to develop succession plans for key management roles, with actions agreed and reviewed on a regular basis by the group's Executive Committee.
IT systems infrastructure and operational resilience
We operate an extensive and complex technology landscape, which must remain resilient in order to support customers, the group and markets where we operate. Risks arise where technology is not understood, maintained, or developed appropriately. We remain committed to investing in the reliability and resilience of our IT systems and critical services. The group does so in order to protect its customers, affiliates and counterparties, and to help ensure they do not receive disruption to services that could result in reputational, legal and regulatory consequences. Increased pressure has been seen on our business operations and customer support centres as our people, processes and systems have responded to meet the current economic environment.
The group's strategy includes simplification of our technology estate to reduce complexity and costs; this includes consolidation of our core banking systems onto a single strategic platform. The target state will leverage existing and known technology, and will be simpler and easier to maintain. However, as with any strategic transformation programme risks associated with implementation must be managed continuously.
Mitigating actions
• We continue to invest in transforming how software solutions are developed, delivered and maintained. We invest both to improve system resilience and to test service continuity. We continue to ensure security is built into our software development life cycle and to seek to improve our testing processes and tools.
• We continue to upgrade our IT systems, simplify our service provision and replace older IT infrastructure and applications.
• We manage implementation risks arising from the simplification of our technology estate continuously via oversight of these risks at all levels of the programme and reporting up to our Risk Committee.
Execution risk
In order to deliver our strategic objectives and meet mandatory regulatory requirements, it is important for the group to maintain a strong focus on execution risk. This requires robust management of significant resource-intensive and time-sensitive programmes that are due to execute in 2023. Risks arising from the magnitude and complexity of change planned in 2023 may include regulatory censure, reputational damage and/or financial losses. Current major initiatives include managing the operational implications of the planned disposal of our retail banking operations in France, large transformation programmes including the simplification and integration of our IT systems and other restructuring programmes across Europe.
Mitigating actions
• Change execution risk was added to our risk taxonomy and control library in 2022, so that the risk can be defined, assessed, managed, reported and overseen in the same way as the group's other material risks.
• Our prioritisation and governance processes for significant programmes are monitored by the HSBC Bank plc and Group's Executive Committees.
• We continue to work to strengthen our change management practices in order to try and deliver sustainable change, increased adoption of agile ways of working, and a more consistent standard of delivery. For HSBC Bank plc, this
includes strengthening the embedding of an improved Group-wide change framework which sets out the mandatory principles and standards to be adhered to when leading and delivering change.
Model risk
Model risk arises whenever business decision making includes reliance on models. We use models in both financial and non-financial contexts and in a range of business applications such as customer selection, product pricing, financial crime transaction monitoring, creditworthiness evaluation and financial reporting. Assessing model performance is a continuous undertaking. Models can need redevelopment as market conditions change. Significant increases in global inflation and interest rates have impacted the reliability and accuracy of both credit risk and traded risk models.
We continued to prioritise the redevelopment of internal ratings-based ('IRB'), internal model approach ('IMA') and internal model methods ('IMM') models, as part of the IRB repair and Basel III programmes with a key focus on enhancing the quality of data used as model inputs. A number of these models have been submitted to the PRA and the European Central Bank ('ECB') for feedback and approval is in progress.
Some IMM models have been approved for use and feedback has been received for some IRB models. Climate risk modelling is a key focus as our commitment to sustainability has become a critical part of the group's strategy.
Mitigating actions
• We have continued to embed the enhanced monitoring, review and challenge of expected loss model performance through our Model Risk Management function as part of a broader quarterly process to determine loss levels. The Model Risk Management team aims to provide strong and effective review and challenge of any future redevelopment of these models.
• Model Risk Management works closely with our lines of business to ensure that our models meet regulatory requirements as well as risk management, pricing, liquidity and capital management needs. Internal Audit provides assurance over the risk management framework for models.
• Additional assurance work is performed by the model risk governance teams, which act as second lines of defence. The teams test whether controls implemented by model users comply with model risk policy and if model risk standards are adequate.
• Models using advanced machine learning techniques are validated and monitored to try and ensure that model risks arising from the usage of those algorithms have adequate oversight and review.
• A framework to manage the range of risks that are generated by these advanced techniques is being developed to try and capture the multi-disciplinary nature of these risks.
Data risk
We use multiple systems and growing quantities of data to support our customers. Risk arises if data is incorrect, unavailable, misused, or unprotected. We need to meet external regulatory obligations and laws that cover data, such as the Basel Committee on Banking Supervision's 239 guidelines and the General Data Protection Regulation ('GDPR').
Mitigating actions
• Through our global data management framework, we monitor the quality, availability and security of data that supports our customers and internal processes. We work towards resolving any identified data issues in a timely manner.
• We have made improvements to our data policies. We are implementing an updated control framework to enhance the end-to-end management of data risk.
• We aim to protect customer data through our data privacy framework, which establishes practices, design principles and guidelines that enable us to demonstrate compliance with data privacy laws and regulations.
•
• We seek to continue to modernise our data and analytics infrastructure through investments in Cloud technology, data visualisation, machine learning and artificial intelligence.
• We educate our employees on data risk and data management. We delivered regular mandatory training on how to protect and manage data appropriately.
Third Party risk
We use third parties to provide a range of goods and services. Risks arising from the use of third-party providers and their supply chain may be harder to identify.
It is critical that we ensure we have appropriate risk management policies, processes and practices over the selection, governance and oversight of third parties and their supply chain, particularly for key activities that could affect our operational resilience.
Any deficiency in the management of risks associated with our third parties could affect our ability to support our customers and meet regulatory expectations.
Mitigating actions
• We have enhanced our control framework for the use of third-party providers to seek to ensure risks associated with these arrangements are understood and managed effectively by our businesses and functions across the group.
• We continue to enhance the effective management of our intra-group arrangements as we have for external third-party arrangements using the same control standards.
• We are implementing the changes required by new regulations as set by our regulators.
| Our material banking and insurance risks |
The material risk types associated with our banking and insurance manufacturing operations are described in the following tables.
| Description of risks - banking operations (continued) |
||
| |
|
|
| Credit risk (see page 36) |
|
|
| The risk of financial loss if a customer or counterparty fails to meet an obligation under a contract. |
Credit risk arises principally from direct lending, trade finance and leasing business, but also from certain other products such as guarantees and derivatives. |
Credit risk is: • measured as the amount that could be lost if a customer or counterparty fails to make repayments; • monitored using various internal risk management measures and within limits approved by individuals within a framework of delegated authorities; and • managed through a robust risk control framework that outlines clear and consistent policies, principles and guidance for risk managers. |
| Treasury risk (see page 75) |
|
|
| The risk of having insufficient capital, liquidity or funding resources to meet financial obligations and satisfy regulatory requirements, including the risk of adverse impact on earnings or capital due to structural foreign exchange exposures and changes in market interest rates, and including the financial risks arising from historic and current provision of pensions and other post employment benefits to staff and their dependants. |
Treasury risk arises from changes to the respective resources and risk profiles driven by customer behaviour, management decisions or the external environment. |
Treasury risk is: • measured through appetites set as target and minimum ratios; • monitored and projected against appetites and using stress and scenario testing; and • managed through control of resources in conjunction with risk profiles and cashflows. |
| Market risk (see page 84) |
|
|
| The risk that movements in market factors such as foreign exchange rates, interest rates, credit spreads, equity prices and commodity prices will reduce our income or the value of our portfolios. |
Exposure to market risk is separated into two portfolios: • trading portfolios; and • non-trading portfolios. Market risk exposures arising from our insurance operations are discussed on page 90. |
Market risk is: • measured using sensitivities, value at risk ('VaR') and stress testing, giving a detailed picture of potential gains and losses for a range of market movements and scenarios, as well as tail risks over specified time horizons; • monitored using VaR, stress testing and other measures, including the sensitivity of net interest income and the sensitivity of structural foreign exchange; and • managed using risk limits approved by the risk management meeting ('RMM') and the RMM in various global businesses. |
|
|
|
|
| Climate risk (see page 86) |
|
|
| Climate risk relates to the financial and non-financial impacts that may arise as a result of climate change and the move to a greener economy. |
Climate risk can materialise through: • physical risk, which arises from the increased frequency and severity of weather events; • transition risk, which arises from the process of moving to a low-carbon economy; and • greenwashing risk, which arises from the act of knowingly or unknowingly misleading stakeholders regarding our strategy relating to climate, the climate impact/benefit of a product or service, or the climate commitments or performance of our customers. |
Climate risk is: • measured using a variety of risk appetite metrics and Key Management Indicators, which assess the impact of climate risk across the risk taxonomy; • monitored using stress testing; and • managed through adherence to risk appetite thresholds and via specific policies. |
| Resilience risk (see page 87) |
|
|
| Resilience risk is the risk that we are unable to provide critical services to our customers, affiliates, and counterparties as a result of sustained and significant operational disruption. |
Resilience risk arises from failures or inadequacies in processes, people, systems or external events. These may be driven by rapid technological innovation, changing behaviours of our consumers, cyber-threats and attacks, cross border dependencies, and third party relationships. |
Resilience risk is: • measured through a range of metrics with defined maximum acceptable impact tolerances, and against our agreed risk appetite. • monitored through oversight of enterprise processes, risks, controls and strategic change programmes; and • managed by continuous monitoring and thematic reviews. |
| Regulatory compliance risk (see page 87) |
|
|
| Regulatory compliance risk is the risk associated with breaching our duty to clients and other counterparties, inappropriate market conduct and breaching related financial services regulatory standards. |
Regulatory compliance risk arises from the failure to observe the letter and spirit of relevant laws, codes, rules, regulations and standards of good practice. This could result in poor market or customer outcomes leading to fines, penalties and reputational damage to our business. |
Regulatory compliance risk is: • measured by reference to risk appetite, identified metrics, incident assessments, regulatory feedback and the judgement and assessment of our regulatory compliance teams; • monitored against the first line of defence risk and control assessments, the results of the monitoring and control assurance activities of the second line of defence functions, and the results of internal and external audits and regulatory inspections; and • managed by establishing and communicating appropriate policies and procedures, training employees in them and monitoring activity to help ensure their observance. Proactive risk control and/or remediation work is undertaken where required. |
| Financial crime risk (see page 88) |
||
| Financial crime risk is the risk of knowingly or unknowingly helping parties to commit or to further potentially illegal activity through HSBC, including money laundering, fraud, bribery and corruption, tax evasion, sanctions breaches, and terrorist and proliferation financing. |
Financial crime risk arises from day-to-day banking operations involving customers, third parties and employees. |
Financial crime risk is: • measured by reference to risk appetite, identified metrics, incident assessments, regulatory feedback and the judgement of, and assessment by, our regulatory compliance teams; • monitored against the first line of defence risk and control assessments, the results of the monitoring and control assurance activities of the second line of defence functions, and the results of internal and external audits and regulatory inspections; and • managed by establishing and communicating appropriate policies and procedures, training employees in them and monitoring activity to help ensure their observance. Proactive risk control and/or remediation work is undertaken where required. |
| Model risk (see page 89) |
||
| Model risk is the potential for adverse consequences from business decisions informed by models, which can be exacerbated by errors in methodology, design or the way they are used.
|
Model risk arises in both financial and non-financial contexts whenever business decision making includes reliance on models. |
Model risk is: • measured by reference to model performance tracking and the output of detailed technical reviews, with key metrics including model review statuses and findings; • monitored against model risk appetite statements, insight from the independent review function, feedback from internal and external audits, and regulatory reviews; and • managed by creating and communicating appropriate policies, procedures and guidance, training colleagues in their application, and supervising their adoption to ensure operational effectiveness.
|
Our insurance manufacturing subsidiaries are regulated separately from our banking operations. Risks in our insurance entities are managed using methodologies and processes that are subject to Group oversight. Our insurance operations are also subject to
some of the same risks as our banking operations, and these are covered by the Group's risk management processes. There are though specific risks inherent to the insurance operations as noted below.
| Description of risks - insurance manufacturing operations |
||
| |
|
|
| Financial risk (see page 90) |
|
|
| For insurance entities, Financial risk includes the risk of not being able to |
Exposure to financial risks arises from: • market risk affecting the fair values of financial assets or their future cash flows; • credit risk; and • liquidity risk of entities not being able to make payments to policyholders as they fall due. |
Financial risk is: • measured (i) for credit risk, in terms of economic capital and the amount that could be lost if a counterparty fails to make repayments; (ii) for market risk, in terms of economic capital, internal metrics and fluctuations in key financial variables; and (iii) for liquidity risk, in terms of internal metrics, including stressed operational cash flow projections; • monitored through a framework of approved limits and delegated authorities; and • managed through a robust risk control framework that outlines clear and consistent policies, principles and guidance. This includes using product design and asset liability matching and bonus rates. |
| Insurance risk (see page 90) |
|
|
| The risk that, over time, the cost of the contract, including claims and benefits may exceed the total amount of premiums and investment income received. |
The cost of claims and benefits can be influenced by many factors, including mortality and morbidity experience, as well as lapse and surrender rates. |
Insurance risk is: • measured in terms of life insurance liabilities and economic capital allocated to insurance underwriting risk; • monitored though a framework of approved limits and delegated authorities; and • managed through a robust risk control framework that outlines clear and consistent policies, principles and guidance. This includes using product design, underwriting, reinsurance and claims-handling procedures. |
| Credit risk |
Credit risk is the risk of financial loss if a customer or counterparty fails to meet an obligation under a contract. Credit risk arises principally from direct lending, trade finance and leasing business, but also from certain other products, such as guarantees and derivatives.
Credit risk management
Key developments in 2022
There were no material changes to the policies and practices for the management of credit risk in 2022. We continued to apply the requirements of IFRS 9 'Financial Instruments' within the Credit Risk sub-function. For certain retail portfolios we enhanced the significant increase in credit risk ('SICR') approach to capture relative movements in probability of default ('PD') since origination.
For our retail portfolios, we adopted the EBA 'Guidelines on the application of definition of default' during 2022 and, for our wholesale portfolios, these guidelines were adopted during 2021. Adoption of these guidelines did not have a material impact on our portfolios and comparative disclosures have not been restated.
We actively managed the risks related to macroeconomic uncertainties, including inflation, fiscal and monetary policy, the Russia-Ukraine war, broader geopolitical uncertainties, the continued risks resulting from the Covid-19 pandemic.
For further details, see 'Top and emerging risks' on page 28.
Governance and structure
We have established group-wide credit risk management and related IFRS 9 processes. We continue to actively assess the impact of economic developments in key markets on specific customers, customer segments or portfolios. As credit conditions change, we take mitigating action, including the revision of risk appetites or limits and tenors, as appropriate. In addition, we continue to evaluate the terms under which we provide credit facilities within the context of individual customer requirements, the quality of the relationship, local regulatory requirements, market practices and our local market position.
Credit risk sub-function
(Audited)
Credit approval authorities are delegated by the Board to the Chief Executive together with the authority to sub-delegate them. The Credit risk sub-function in Risk is responsible for the key policies and processes for managing credit risk, which include formulating credit policies and risk rating frameworks, guiding the appetite for credit risk exposures, undertaking independent reviews and objective assessment of credit risk, and monitoring performance and management of portfolios.
The principal objectives of our credit risk management are:
• to maintain across the group a strong culture of responsible lending and a robust risk policy and control framework;
• to both partner and challenge global businesses in defining, implementing and continually re-evaluating our risk appetite under actual and scenario conditions; and
• to ensure there is independent, expert scrutiny of credit risks, their costs and mitigation.
Key risk management process
IFRS 9 'Financial Instruments' process
The IFRS 9 process comprises three main areas: modelling and data; implementation; and governance.
Modelling, data and forward economic guidance
The Group has established IFRS 9 modelling and data processes in various geographies, which are subject to internal model risk governance including independent review of significant model developments.
We have a centralised process for generating unbiased and independent global economic scenarios. Scenarios are subject to a process of review and challenge by a dedicated team, as well as regional groupings. Each quarter, the scenarios and probability weights are reviewed and checked for consistency with the economic conjuncture and current economic and financial risks. These are subject to final review and approval by senior management in a Forward Economic Guidance Global Business Impairment Committee.
Implementation
A centralised impairment engine performs the ECL calculation using data, which is subject to a number of validation checks and enhancements, from a variety of client, finance and risk systems. Where possible, these checks and processes are performed in a globally consistent and centralised manner.
Governance
Management review forums are established in order to review and approve the impairment results. Regional management review forums have representatives from Credit Risk and Finance. Required members of the forums are the heads of Wholesale Credit, Market Risk, and Wealth and Personal Banking Risk, as well as the global business Chief Financial Officers and the Chief Accounting Officer.
Concentration of exposure
(Audited)
Concentrations of credit risk arise when a number of counterparties or exposures have comparable economic characteristics, or are engaged in similar activities or operate in the same geographical areas/industry sectors, so that their collective ability to meet contractual obligations is uniformly affected by changes in economic, political or other conditions. The group uses a number of controls and measures to minimise undue concentration of exposure in the group's portfolios across industry, country and customer groups. These include portfolio and counterparty limits, approval and review controls, and stress testing.
Credit quality of financial instruments
(Audited)
Our risk rating system facilitates the internal ratings-based approach under the Basel framework adopted by the Group to support the calculation of our minimum credit regulatory capital requirement. The five credit quality classifications each encompass a range of granular internal credit rating grades assigned to wholesale and retail lending businesses, and the external ratings attributed by external agencies to debt securities.
For debt securities and certain other financial instruments, external ratings have been aligned to the five quality classifications based upon the mapping of related Customer Risk Rating ('CRR') to external credit rating.
Wholesale lending
The CRR 10-grade scale summarises a more granular underlying 23-grade scale of obligor PD. All corporate customers are rated using the 10- or 23-grade scale, depending on the degree of sophistication of the Basel approach adopted for the exposure.
Each CRR band is associated with an external rating grade by reference to long-run default rates for that grade, represented by the average of issuer-weighted historical default rates. This mapping between internal and external ratings is indicative and may vary over time.
Retail lending
Retail lending credit quality is based on a 12-month point-in-time probability-weighted PD.
| Credit quality classification |
||||||
|
|
Sovereign debt securities and bills |
Other debt securities and bills |
Wholesale lending and derivatives |
Retail lending |
||
|
|
External |
External |
Internal |
12-month probability of |
Internal |
12 month probability-weighted PD % |
| Quality classification1,2 |
|
|
|
|
|
|
| Strong |
BBB and above |
A- and above |
CRR1 to CRR21 |
0 - 0.169 |
Band 1 and 2 |
0.000 - 0.500 |
| Good |
BBB- to BB |
BBB+ to BBB- |
CRR3 |
0.170 - 0.740 |
Band 3 |
0.501 - 1.500 |
| Satisfactory |
BB- to B and unrated |
BB+ to B and unrated |
CRR4 to CRR5 |
0.741 - 4.914 |
Band 4 and 5 |
1.501 - 20.000 |
| Sub-standard |
B- to C |
B- to C |
CRR6 to CRR8 |
4.915 - 99.999 |
Band 6 |
20.001 - 99.999 |
| Credit impaired |
Default |
Default |
CRR9 to CRR10 |
100 |
Band 7 |
100 |
1 Customer risk rating ('CRR').
2 12-month point-in-time probability-weighted PD.
| Quality classification definitions • 'Strong' exposures demonstrate a strong capacity to meet financial commitments, with negligible or low probability of default and/or low levels of expected loss. • 'Good' exposures require closer monitoring and demonstrate a good capacity to meet financial commitments, with low default risk. • 'Satisfactory' exposures require closer monitoring and demonstrate an average to fair capacity to meet financial commitments, with moderate default risk. • 'Sub-standard' exposures require varying degrees of special attention and default risk is of greater concern. • 'Credit-impaired' exposures have been assessed as described in Note 1.2(i) on the Financial Statements. |
Forborne loans and advances
(Audited)
Forbearance measures consist of concessions towards an obligor that is experiencing or about to experience difficulties in meeting its financial commitments.
We continue to class loans as forborne when we modify the contractual payment terms due to having significant concerns about the borrowers' ability to meet contractual payments when they were due.
In 2022, we expanded our definition of forborne to capture non-payment-related concessions, such as covenant waivers. For our wholesale portfolio, we began identifying non-payment-related concessions in 2021 when our internal policies were changed. For our retail portfolios, we began identifying them during 2022.
The comparative disclosures have been presented under the prior definition of forborne for the wholesale and retail portfolios.
For details of our policy on derecognised renegotiated loans, see Note 1.2(i) on the financial statements.
Credit quality of forborne loans
For wholesale lending, where payment related forbearance measures result in a diminished financial obligation or if there are other indicators of impairment, the loan will be classified as credit impaired if it is not already so classified. All facilities with a customer, including loans that have not been modified, are considered credit impaired following the identification of a payment-related forborne loan. For retail lending, where a material payment-related concession has been granted, the loan will be classified as credit impaired.
In isolation, non-payment forbearance measures may not result in the loan being classified as credit impaired unless combined with other indicators of credit impairment. These are classed as performing forborne loans for both wholesale and retail lending.
Wholesale and retail lending forborne loans are classified as credit impaired until there is sufficient evidence to demonstrate a significant reduction in the risk of non-payment of future cash flows, observed over a minimum one-year period, and there are no other indicators of impairment. Any forborne loans not considered credit impaired will remain forborne for a minimum of two years from the date that credit impairment no longer applies. For wholesale and retail lending, any forbearance measures granted on a loan already classed as forborne results in customer being classed as credit impaired.
Forborne loans and recognition of expected credit losses
(Audited)
Forborne loans expected credit loss assessments reflect the higher rates of losses typically experienced with these types of loans such that they are in stage 2 and stage 3. The higher rates are more pronounced in unsecured retail lending requiring further segmentation. For wholesale lending, forborne loans are typically assessed individually. Credit risk ratings are intrinsic to the impairment assessments. The individual impairment assessment takes into account the higher risk of the future non-payment inherent in forborne loans.
Impairment assessment
(Audited)
For details of our impairment policies on loans and advances and financial investments see Note 1.2(i) on the financial statements.
Write-off of loans and advances
(Audited)
For details of our accounting policy on the write-off of loans and advances, see Note 1.2(i) on the financial statements.
Unsecured personal facilities, including credit cards, are generally written off at between 150 and 210 days past due. The standard period runs until the end of the month in which the account becomes 180 days contractually delinquent. However, in exceptional circumstances to achieve a fair customer outcome, and in line with regulatory expectations, they may be extended further.
For secured facilities, write-off should occur upon repossession of collateral, receipt of proceeds via settlement, or determination that recovery of the collateral will not be pursued.
Any secured assets maintained on the balance sheet beyond 60 months of consecutive delinquency-driven default require additional monitoring and review to assess the prospect of recovery.
There are exceptions in a few countries and territories where local regulation or legislation constrain earlier write-off, or where the realisation of collateral for secured real estate lending takes more time. Write-off, either partially or in full, may be earlier when there is no reasonable expectation of further recovery, for example, in the event of a bankruptcy or equivalent legal proceedings. Collection procedures may continue after write-off.
Credit risk in 2022
At 31 December 2022, gross loans and advances to customers and banks of £91bn decreased by £12bn, compared with 31 December 2021. This included favourable foreign exchange movements of £3bn and a £22bn decrease due to a reclassification of businesses to assets held for sale, including our retail banking operations in France.
The reclassification of assets held for sale resulted in a decrease of loans and advances to customers, of which £2bn pertaining to wholesale and £19bn to personal banking. For loans and advances to banks, the reclassification resulted in a decrease of £1bn.
Excluding foreign exchange movements and the reclassification of assets held for sale, there was £1bn decrease in personal loans and advances, offset by £1bn increase in wholesale loans and advances to customers. Loans and advances to banks increased by £7bn.
At 31 December 2022, the allowance for ECL excluding foreign exchange movements and the reclassification of assets held for sale, in relation to loans and advances to customers increased by £50m from 31 December 2021.
This was attributable to:
• a £46m increase in wholesale loans and advances to customers, of which £44m was driven by stages 1 and 2; and
• a £4m increase in personal loans and advances to customers, of which £7m was driven by stages 1 and 2.
Stage 3 balances at 31 December 2022 remained broadly stable compared with 31 December 2021.
The ECL charge for 2022 was £222m, inclusive of recoveries. Inflation, recession and high interest rates combined with an unstable geopolitical environment and the effects of a global supply chain disruption have contributed to elevated degrees of uncertainty during the year. At 31 December 2022, as a result of this uncertainty, additional stage 1 and 2 allowances have been recorded.
Summary of credit risk
The following disclosure presents the gross carrying/nominal amount of financial instruments to which the impairment requirements in IFRS9 are applied and the associated allowance for ECL. The allowance for ECL increased from £1,240m at 31 December 2021 to £1,370m at 31 December 2022.
The allowance for ECL at 31 December 2022 comprised of £1,283m (2021: £1,168m) in respect of assets held at amortised cost, £87m (2021: £72m) in respect of loans and other credit related commitments, and financial guarantees, and £24m (2021: £19m) in respect of debt instruments measured at FVOCI.
| Summary of financial instruments to which the impairment requirements in IFRS 9 are applied |
||||
| (Audited) |
|
|
|
|
|
|
31 Dec 2022 |
31 Dec 2021 |
||
|
|
Gross carrying/nominal amount |
Allowance for ECL1 |
Gross carrying/nominal amount |
Allowance for ECL1 |
| The group |
£m |
£m |
£m |
£m |
| Loans and advances to customers at amortised cost |
73,717 |
(1,103) |
92,331 |
(1,154) |
| - personal |
6,013 |
(55) |
25,394 |
(163) |
| - corporate and commercial |
55,004 |
(937) |
56,087 |
(964) |
| - non-bank financial institutions |
12,700 |
(111) |
10,850 |
(27) |
| Loans and advances to banks at amortised cost |
17,152 |
(43) |
10,789 |
(5) |
| Other financial assets measured at amortised cost |
269,755 |
(137) |
202,137 |
(9) |
| - cash and balances at central banks |
131,434 |
(1) |
108,482 |
- |
| - items in the course of collection from other banks |
2,285 |
- |
346 |
- |
| - Hong Kong Government certificates of indebtedness |
- |
- |
- |
- |
| - reverse repurchase agreements - non trading |
53,949 |
- |
54,448 |
- |
| - financial investments |
3,248 |
- |
10 |
- |
| - other assets2 |
55,634 |
(3) |
38,851 |
(9) |
| - assets held for sale6 |
23,205 |
(133) |
- |
- |
| Total gross carrying amount on balance sheet |
360,624 |
(1,283) |
305,257 |
(1,168) |
| Loans and other credit related commitments |
126,457 |
(67) |
115,695 |
(55) |
| - personal |
2,116 |
- |
2,269 |
(1) |
| - corporate and commercial |
68,441 |
(62) |
63,352 |
(48) |
| - financial |
55,900 |
(5) |
50,074 |
(6) |
| Financial guarantees3 |
5,327 |
(20) |
11,054 |
(17) |
| - personal |
23 |
- |
26 |
- |
| - corporate and commercial |
3,415 |
(19) |
9,894 |
(16) |
| - financial |
1,889 |
(1) |
1,134 |
(1) |
| Total nominal amount off balance sheet4 |
131,784 |
(87) |
126,749 |
(72) |
|
|
492,408 |
(1,370) |
432,006 |
(1,240) |
|
|
|
|
|
|
|
|
Fair value |
Memorandum allowance for ECL5 |
Fair value |
Memorandum allowance for ECL5 |
|
|
£m |
£m |
£m |
£m |
| Debt instruments measured at fair value through other comprehensive income ('FVOCI') |
29,248 |
(24) |
41,188 |
(19) |
1 The total ECL is recognised in the loss allowance for the financial asset unless the total ECL exceeds the gross carrying amount of the financial asset, in which case the ECL is recognised as a provision.
2 Includes only those financial instruments which are subject to the impairment requirements of IFRS 9. 'Prepayments, accrued income and other assets' as presented within the consolidated balance sheet on page 116 includes both financial and non-financial assets, including cash collateral and settlement accounts.
3 Excludes performance guarantee contracts to which the impairment requirements in IFRS 9 are not applied.
4 Represents the maximum amount at risk should the contracts be fully drawn upon and clients default.
5 Debt instruments measured at FVOCI continue to be measured at fair value with the allowance for ECL as a memorandum item. Change in ECL is recognised in 'Change in expected credit losses and other credit impairment charges' in the income statement.
6 For further details on gross carrying amounts and allowances for ECL related to assets held for sale, see 'Assets held for sale' on page 186.
| Summary of financial instruments to which the impairment requirements in IFRS 9 are applied (continued) |
||||
| (Audited) |
|
|
|
|
|
|
31 Dec 2022 |
31 Dec 2021 |
||
|
|
Gross carrying/nominal amount |
Allowance for ECL1 |
Gross carrying/nominal amount |
Allowance for ECL1 |
| The bank |
£m |
£m |
£m |
£m |
| Loans and advances to customers at amortised cost |
37,370 |
(378) |
34,286 |
(350) |
| - personal |
3,584 |
(12) |
3,680 |
(6) |
| - corporate and commercial |
22,456 |
(247) |
21,182 |
(308) |
| - non-bank financial institutions |
11,330 |
(119) |
9,424 |
(36) |
| Loans and advances to banks at amortised cost |
14,529 |
(43) |
6,782 |
(4) |
| Other financial assets measured at amortised cost |
169,321 |
(3) |
135,033 |
(1) |
| - cash and balances at central banks |
78,442 |
(1) |
63,008 |
- |
| - items in the course of collection from other banks |
1,863 |
- |
211 |
- |
| - reverse repurchase agreements-non trading |
43,055 |
- |
39,708 |
- |
| - financial investments |
6,378 |
- |
3,337 |
- |
| - other assets2 |
39,583 |
(2) |
28,769 |
(1) |
| Total gross carrying amount on balance sheet |
221,220 |
(424) |
176,101 |
(355) |
| Loans and other credit related commitments |
35,692 |
(31) |
31,255 |
(29) |
| - personal |
886 |
- |
589 |
- |
| - corporate and commercial |
18,900 |
(28) |
19,175 |
(26) |
| - financial |
15,906 |
(3) |
11,491 |
(3) |
| Financial guarantees3 |
1,363 |
(12) |
1,270 |
(7) |
| - personal |
3 |
- |
3 |
- |
| - corporate and commercial |
827 |
(11) |
527 |
(6) |
| - financial |
533 |
(1) |
740 |
(1) |
| Total nominal amount off balance sheet4 |
37,055 |
(43) |
32,525 |
(36) |
|
|
258,275 |
(467) |
208,626 |
(391) |
|
|
|
|
|
|
|
|
Fair value |
Memorandum allowance for ECL5 |
Fair value |
Memorandum allowance for ECL5 |
|
|
£m |
£m |
£m |
£m |
| Debt instruments measured at FVOCI |
12,206 |
(4) |
23,152 |
(4) |
1 The total ECL is recognised in the loss allowance for the financial asset unless the total ECL exceeds the gross carrying amount of the financial asset, in which case the ECL is recognised as a provision.
2 Includes only those financial instruments which are subject to the impairment requirements of IFRS 9. 'Prepayments, accrued income and other assets' as presented within the consolidated balance sheet on page 116 includes both financial and non-financial assets, including cash collateral and settlement accounts.
3 Excludes performance guarantee contracts to which the impairment requirements in IFRS 9 are not applied.
4 Represents the maximum amount at risk should the contracts be fully drawn upon and clients default.
5 Debt instruments measured at FVOCI continue to be measured at fair value with the allowance for ECL as a memorandum item. Change in ECL is recognised in 'Change in expected credit losses and other credit impairment charges' in the income statement.
The following table provides an overview of the group's and bank's credit risk by stage and industry, and the associated ECL coverage. The financial assets recorded in each stage have the following characteristics:
• Stage 1: These financial assets are unimpaired and without significant increase in credit risk on which a 12-month allowance for ECL is recognised.
• Stage 2: A significant increase in credit risk has been experienced since initial recognition on which a lifetime ECL is recognised.
•
Stage 3: There is objective evidence of impairment, and are therefore considered to be in default or otherwise credit-impaired on which a lifetime ECL is recognised.
• Purchased or originated credit-impaired ('POCI'): Financial assets that are purchased or originated at a deep discount that reflects the incurred credit losses on which a lifetime ECL is recognised.
| Summary of credit risk (excluding debt instruments measured at FVOCI) by stage distribution and ECL coverage by industry sector at |
|||||||||||||||
| (Audited) |
|||||||||||||||
|
|
Gross carrying/nominal amount2 |
Allowance for ECL |
ECL coverage % |
||||||||||||
|
|
Stage 1 |
Stage 2 |
Stage 3 |
POCI3 |
Total |
Stage 1 |
Stage 2 |
Stage 3 |
POCI3 |
Total |
Stage 1 |
Stage 2 |
Stage 3 |
POCI3 |
Total |
| The group |
£m |
£m |
£m |
£m |
£m |
£m |
£m |
£m |
£m |
£m |
% |
% |
% |
% |
% |
| Loans and advances to customers at amortised cost |
63,673 |
7,817 |
2,224 |
3 |
73,717 |
(51) |
(145) |
(907) |
- |
(1,103) |
0.1 |
1.9 |
40.8 |
- |
1.5 |
| - personal |
5,293 |
615 |
105 |
- |
6,013 |
(9) |
(15) |
(31) |
- |
(55) |
0.2 |
2.4 |
29.5 |
- |
0.9 |
| - corporate and commercial |
46,671 |
6,479 |
1,851 |
3 |
55,004 |
(40) |
(123) |
(774) |
- |
(937) |
0.1 |
1.9 |
41.8 |
- |
1.7 |
| - non-bank financial institutions |
11,709 |
723 |
268 |
- |
12,700 |
(2) |
(7) |
(102) |
- |
(111) |
- |
1.0 |
38.1 |
- |
0.9 |
| Loans and advances to banks at amortised cost |
16,673 |
414 |
65 |
- |
17,152 |
(6) |
(21) |
(16) |
- |
(43) |
- |
5.1 |
24.6 |
- |
0.3 |
| Other financial assets measured at amortised cost |
267,770 |
1,662 |
323 |
- |
269,755 |
(14) |
(17) |
(106) |
- |
(137) |
- |
1.0 |
32.8 |
- |
0.1 |
| Loan and other credit-related commitments |
116,994 |
9,300 |
163 |
- |
126,457 |
(13) |
(32) |
(22) |
- |
(67) |
- |
0.3 |
13.5 |
- |
0.1 |
| - personal |
2,004 |
107 |
5 |
- |
2,116 |
- |
- |
- |
- |
- |
- |
- |
- |
- |
- |
| - corporate and commercial |
60,659 |
7,625 |
157 |
- |
68,441 |
(12) |
(28) |
(22) |
- |
(62) |
- |
0.4 |
14.0 |
- |
0.1 |
| - financial |
54,331 |
1,568 |
1 |
- |
55,900 |
(1) |
(4) |
- |
- |
(5) |
- |
0.3 |
- |
- |
- |
| Financial guarantees1 |
4,715 |
528 |
84 |
- |
5,327 |
(1) |
(2) |
(17) |
- |
(20) |
- |
0.4 |
20.2 |
- |
0.4 |
| - personal |
20 |
2 |
1 |
- |
23 |
- |
- |
- |
- |
- |
- |
- |
- |
- |
- |
| - corporate and commercial |
2,946 |
387 |
82 |
- |
3,415 |
(1) |
(1) |
(17) |
- |
(19) |
- |
0.3 |
20.7 |
- |
0.6 |
| - financial |
1,749 |
139 |
1 |
- |
1,889 |
- |
(1) |
- |
- |
(1) |
- |
0.7 |
- |
- |
0.1 |
| At 31 Dec 2022 |
469,825 |
19,721 |
2,859 |
3 |
492,408 |
(85) |
(217) |
(1,068) |
- |
(1,370) |
- |
1.1 |
37.4 |
- |
0.3 |
1 Excludes performance guarantee contracts to which the impairment requirements in IFRS 9 are not applied.
2 Represents the maximum amount at risk should the contracts be fully drawn upon and clients default.
3 Purchased or originated credit-impaired ('POCI').
Unless identified at an earlier stage, all financial assets are deemed to have suffered a significant increase in credit risk when they are 30 days past due ('DPD') and are transferred from stage 1 to stage 2. The following disclosure presents the ageing of stage 2financial assets by those less than 30 days and greater than 30 DPD and therefore presents those financial assets classified as stage 2 due to ageing (30 DPD) and those identified at an earlier stage (less than 30 DPD).
| Stage 2 days past due analysis at 31 December 2022 |
|||||||||
| (Audited) |
Gross carrying amount |
Allowance for ECL |
ECL coverage % |
||||||
|
|
|
of which: |
of which: |
|
of which: |
of which: |
|
of which: |
of which: |
|
|
Stage 2 |
1 to 29 DPD1,2 |
30 and > DPD1,2 |
Stage 2 |
1 to 29 DPD1,2 |
30 and > DPD1,2 |
Stage 2 |
1 to 29 DPD1,2 |
30 and > DPD1,2 |
| The group |
£m |
£m |
£m |
£m |
£m |
£m |
% |
% |
% |
| Loans and advances to customers at amortised cost: |
7,817 |
93 |
331 |
(145) |
(2) |
(2) |
1.9 |
2.2 |
0.6 |
| - personal |
615 |
43 |
9 |
(15) |
(2) |
(1) |
2.4 |
4.7 |
11.1 |
| - corporate and commercial |
6,479 |
50 |
296 |
(123) |
- |
(1) |
1.9 |
- |
0.3 |
| - non-bank financial institutions |
723 |
- |
26 |
(7) |
- |
- |
1.0 |
- |
- |
| Loans and advances to banks at amortised cost |
414 |
- |
8 |
(21) |
- |
- |
5.1 |
- |
- |
| Other financial assets measured at amortised cost |
1,662 |
25 |
12 |
(17) |
- |
(2) |
1.0 |
- |
16.7 |
1 Days past due ('DPD'). Up-to-date accounts in stage 2 are not shown in amounts presented above.
2 The days past due amounts presented above are on a contractual basis and include the benefit of any customer relief payment holidays granted.
| Summary of credit risk (excluding debt instruments measured at FVOCI) by stage distribution and ECL coverage by industry sector at |
|||||||||||||||
| (Audited) |
|||||||||||||||
|
|
Gross carrying/nominal amount2 |
Allowance for ECL |
ECL coverage % |
||||||||||||
|
|
Stage 1 |
Stage 2 |
Stage 3 |
POCI3 |
Total |
Stage 1 |
Stage 2 |
Stage 3 |
POCI3 |
Total |
Stage 1 |
Stage 2 |
Stage 3 |
POCI3 |
Total |
| The group |
£m |
£m |
£m |
£m |
£m |
£m |
£m |
£m |
£m |
£m |
% |
% |
% |
% |
% |
| Loans and advances to customers at amortised cost |
80,730 |
9,121 |
2,478 |
2 |
92,331 |
(86) |
(158) |
(908) |
(2) |
(1,154) |
0.1 |
1.7 |
36.6 |
100.0 |
1.2 |
| - personal |
24,255 |
686 |
453 |
- |
25,394 |
(22) |
(16) |
(125) |
- |
(163) |
0.1 |
2.3 |
27.6 |
- |
0.6 |
| - corporate and commercial |
46,237 |
8,066 |
1,782 |
2 |
56,087 |
(58) |
(137) |
(767) |
(2) |
(964) |
0.1 |
1.7 |
43.0 |
100.0 |
1.7 |
| - non-bank financial institutions |
10,238 |
369 |
243 |
- |
10,850 |
(6) |
(5) |
(16) |
- |
(27) |
0.1 |
1.4 |
6.6 |
- |
0.2 |
| Loans and advances to banks at amortised cost |
10,750 |
39 |
- |
- |
10,789 |
(4) |
(1) |
- |
- |
(5) |
- |
2.6 |
- |
- |
- |
| Other financial assets measured at amortised cost |
202,048 |
47 |
42 |
- |
202,137 |
- |
- |
(9) |
- |
(9) |
- |
- |
21.4 |
- |
- |
| Loan and other credit-related commitments |
107,922 |
7,571 |
202 |
- |
115,695 |
(25) |
(22) |
(8) |
- |
(55) |
- |
0.3 |
4.0 |
- |
- |
| - personal |
2,152 |
114 |
3 |
- |
2,269 |
(1) |
- |
- |
- |
(1) |
- |
- |
- |
- |
- |
| - corporate and commercial |
56,325 |
6,829 |
198 |
- |
63,352 |
(20) |
(20) |
(8) |
- |
(48) |
- |
0.3 |
4.0 |
- |
0.1 |
| - financial |
49,445 |
628 |
1 |
- |
50,074 |
(4) |
(2) |
- |
- |
(6) |
- |
0.3 |
- |
- |
- |
| Financial guarantees1 |
10,215 |
740 |
99 |
- |
11,054 |
(3) |
(7) |
(7) |
- |
(17) |
- |
0.9 |
7.1 |
- |
0.2 |
| - personal |
23 |
2 |
1 |
- |
26 |
- |
- |
- |
- |
- |
- |
- |
- |
- |
- |
| - corporate and commercial |
9,257 |
540 |
97 |
- |
9,894 |
(2) |
(7) |
(7) |
- |
(16) |
- |
1.3 |
7.2 |
- |
0.2 |
| - financial |
935 |
198 |
1 |
- |
1,134 |
(1) |
- |
- |
- |
(1) |
0.1 |
- |
- |
- |
0.1 |
| At 31 Dec 2021 |
411,665 |
17,518 |
2,821 |
2 |
432,006 |
(118) |
(188) |
(932) |
(2) |
(1,240) |
- |
1.1 |
33.0 |
100.0 |
0.3 |
1 Excludes performance guarantee contracts to which the impairment requirements in IFRS 9 are not applied.
2 Represents the maximum amount at risk should the contracts be fully drawn upon and clients default.
3 Purchased or originated credit-impaired ('POCI').
| Stage 2 days past due analysis at 31 December 2021 (continued) |
|||||||||
| (Audited) |
Gross carrying amount |
Allowance for ECL |
ECL coverage % |
||||||
|
|
|
of which: |
of which: |
|
of which: |
of which: |
|
of which: |
of which: |
|
|
Stage 2 |
1 to 29 DPD1,2 |
30 and > DPD1,2 |
Stage 2 |
1 to 29 DPD1,2 |
30 and > DPD1,2 |
Stage 2 |
1 to 29 DPD1,2 |
30 and > DPD1,2 |
| The group |
£m |
£m |
£m |
£m |
£m |
£m |
% |
% |
% |
| Loans and advances to customers at amortised cost |
9,121 |
56 |
237 |
(158) |
(1) |
(1) |
1.7 |
1.8 |
0.4 |
| - personal |
686 |
49 |
29 |
(16) |
(1) |
(1) |
2.3 |
2.0 |
3.4 |
| - corporate and commercial |
8,066 |
7 |
199 |
(137) |
- |
- |
1.7 |
0.0 |
- |
| - non-bank financial institutions |
369 |
- |
9 |
(5) |
- |
- |
1.4 |
- |
- |
| Loans and advances to banks at |
39 |
- |
- |
(1) |
- |
- |
2.6 |
- |
- |
| Other financial assets measured at amortised cost |
47 |
- |
- |
- |
- |
- |
- |
- |
- |
1 Days past due ('DPD'). Up-to-date accounts in stage 2 are not shown in amounts presented above.
2 The days past due amounts presented above are on a contractual basis and include the benefit of any customer relief payment holidays granted.
| Summary of credit risk (excluding debt instruments measured at FVOCI) by stage distribution and ECL coverage by industry sector at |
|||||||||||||||
| (Audited) |
|||||||||||||||
|
|
Gross carrying/nominal amount2 |
Allowance for ECL |
ECL coverage % |
||||||||||||
|
|
Stage 1 |
Stage 2 |
Stage 3 |
POCI3 |
Total |
Stage 1 |
Stage 2 |
Stage 3 |
POCI3 |
Total |
Stage 1 |
Stage 2 |
Stage 3 |
POCI3 |
Total |
| The bank |
£m |
£m |
£m |
£m |
£m |
£m |
£m |
£m |
£m |
£m |
% |
% |
% |
% |
% |
| Loans and advances to customers at amortised cost |
33,919 |
2,576 |
875 |
- |
37,370 |
(19) |
(35) |
(324) |
- |
(378) |
0.1 |
1.4 |
37.0 |
- |
1.0 |
| - personal |
3,090 |
482 |
12 |
- |
3,584 |
(2) |
(7) |
(3) |
- |
(12) |
0.1 |
1.5 |
25.0 |
- |
0.3 |
| - corporate and commercial |
20,314 |
1,547 |
595 |
- |
22,456 |
(16) |
(27) |
(204) |
- |
(247) |
0.1 |
1.7 |
34.3 |
- |
1.1 |
| - non-bank financial institutions |
10,515 |
547 |
268 |
- |
11,330 |
(1) |
(1) |
(117) |
- |
(119) |
- |
0.2 |
43.7 |
- |
1.1 |
| Loans and advances to banks at amortised cost |
14,299 |
165 |
65 |
- |
14,529 |
(5) |
(22) |
(16) |
- |
(43) |
- |
13.3 |
24.6 |
- |
0.3 |
| Other financial assets measured at amortised cost |
169,276 |
24 |
21 |
- |
169,321 |
(2) |
(1) |
- |
- |
(3) |
- |
4.2 |
- |
- |
- |
| Loan and other credit-related commitments |
32,427 |
3,225 |
40 |
- |
35,692 |
(9) |
(15) |
(7) |
- |
(31) |
- |
0.5 |
17.5 |
- |
0.1 |
| - personal |
874 |
10 |
2 |
- |
886 |
- |
- |
- |
- |
- |
- |
- |
- |
- |
- |
| - corporate and commercial |
16,565 |
2,297 |
38 |
- |
18,900 |
(8) |
(13) |
(7) |
- |
(28) |
- |
0.6 |
18.4 |
- |
0.1 |
| - financial |
14,988 |
918 |
- |
- |
15,906 |
(1) |
(2) |
- |
- |
(3) |
- |
0.2 |
- |
- |
- |
| Financial guarantees1 |
1,194 |
133 |
36 |
- |
1,363 |
- |
(1) |
(11) |
- |
(12) |
- |
0.8 |
30.6 |
- |
0.9 |
| - personal |
2 |
1 |
- |
- |
3 |
- |
- |
- |
- |
- |
- |
- |
- |
- |
- |
| - corporate and commercial |
775 |
17 |
35 |
- |
827 |
- |
- |
(11) |
- |
(11) |
- |
- |
31.4 |
- |
1.3 |
| - financial |
417 |
115 |
1 |
- |
533 |
- |
(1) |
- |
- |
(1) |
- |
0.9 |
- |
- |
0.2 |
| At 31 Dec 2022 |
251,115 |
6,123 |
1,037 |
- |
258,275 |
(35) |
(74) |
(358) |
- |
(467) |
- |
1.2 |
34.5 |
- |
0.2 |
1 Excludes performance guarantee contracts to which the impairment requirements in IFRS 9 are not applied.
2 Represents the maximum amount at risk should the contracts be fully drawn upon and clients default.
3 Purchased or originated credit-impaired ('POCI').
| Stage 2 days past due analysis at 31 December 2022 |
|||||||||
| (Audited) |
Gross carrying amount |
Allowance for ECL |
ECL coverage % |
||||||
|
|
|
of which: |
of which: |
|
of which: |
of which: |
|
of which: |
of which: |
|
|
Stage 2 |
1 to 29 DPD1,2 |
30 and > DPD1,2 |
Stage 2 |
1 to 29 DPD1,2 |
30 and > DPD1,2 |
Stage 2 |
1 to 29 DPD1,2 |
30 and > DPD1,2 |
| The bank |
£m |
£m |
£m |
£m |
£m |
£m |
% |
% |
% |
| Loans and advances to customers at amortised cost: |
2,576 |
26 |
6 |
(35) |
(1) |
(1) |
1.4 |
3.8 |
16.7 |
| - personal |
482 |
26 |
6 |
(7) |
(1) |
(1) |
1.5 |
3.8 |
16.7 |
| - corporate and commercial |
1,547 |
- |
- |
(27) |
- |
- |
1.7 |
- |
- |
| - non-bank financial institutions |
547 |
- |
- |
(1) |
- |
- |
0.2 |
- |
- |
| Loans and advances to banks at amortised cost |
165 |
- |
- |
(22) |
- |
- |
13.3 |
- |
- |
| Other financial assets measured at amortised cost |
24 |
- |
- |
(1) |
(1) |
- |
4.2 |
- |
- |
1 Days past due ('DPD'). Up-to-date accounts in stage 2 are not shown in amounts presented above.
2 The days past due amounts presented above are on a contractual basis and include the benefit of any customer relief payment holidays granted.
| Summary of credit risk (excluding debt instruments measured at FVOCI) by stage distribution and ECL coverage by industry sector at |
|||||||||||||||
| (Audited) |
|||||||||||||||
|
|
Gross carrying/nominal amount2 |
Allowance for ECL |
ECL coverage % |
||||||||||||
|
|
Stage 1 |
Stage 2 |
Stage 3 |
POCI3 |
Total |
Stage 1 |
Stage 2 |
Stage 3 |
POCI3 |
Total |
Stage 1 |
Stage 2 |
Stage 3 |
POCI3 |
Total |
| The bank |
£m |
£m |
£m |
£m |
£m |
£m |
£m |
£m |
£m |
£m |
% |
% |
% |
% |
% |
| Loans and advances to customers at amortised cost |
30,105 |
3,197 |
984 |
- |
34,286 |
(33) |
(47) |
(270) |
- |
(350) |
0.1 |
1.5 |
27.4 |
- |
1.0 |
| - personal |
3,544 |
88 |
48 |
- |
3,680 |
(1) |
(2) |
(3) |
- |
(6) |
- |
2.3 |
6.3 |
- |
0.2 |
| - corporate and commercial |
17,608 |
2,893 |
681 |
- |
21,182 |
(28) |
(45) |
(235) |
- |
(308) |
0.2 |
1.6 |
34.5 |
- |
1.5 |
| - non-bank financial institutions |
8,953 |
216 |
255 |
- |
9,424 |
(4) |
- |
(32) |
- |
(36) |
- |
- |
12.5 |
- |
0.4 |
| Loans and advances to banks at amortised cost |
6,775 |
7 |
- |
- |
6,782 |
(3) |
(1) |
- |
- |
(4) |
- |
14.3 |
- |
- |
0.1 |
| Other financial assets measured at amortised cost |
134,984 |
21 |
28 |
- |
135,033 |
- |
- |
(1) |
- |
(1) |
- |
- |
3.6 |
- |
- |
| Loan and other credit-related commitments |
28,911 |
2,301 |
43 |
- |
31,255 |
(15) |
(11) |
(3) |
- |
(29) |
0.1 |
0.5 |
7.0 |
- |
0.1 |
| - personal |
585 |
2 |
2 |
- |
589 |
- |
- |
- |
- |
- |
- |
- |
- |
- |
- |
| - corporate and commercial |
17,010 |
2,124 |
41 |
- |
19,175 |
(12) |
(11) |
(3) |
- |
(26) |
0.1 |
0.5 |
7.3 |
- |
0.1 |
| - financial |
11,316 |
175 |
- |
- |
11,491 |
(3) |
- |
- |
- |
(3) |
- |
- |
- |
- |
- |
| Financial guarantees1 |
1,060 |
150 |
60 |
- |
1,270 |
(1) |
- |
(6) |
- |
(7) |
0.1 |
- |
10.0 |
- |
0.6 |
| - personal |
2 |
1 |
- |
- |
3 |
- |
- |
- |
- |
- |
- |
- |
- |
- |
- |
| - corporate and commercial |
437 |
31 |
59 |
- |
527 |
- |
- |
(6) |
- |
(6) |
- |
- |
10.2 |
- |
1.1 |
| - financial |
621 |
118 |
1 |
- |
740 |
(1) |
- |
- |
- |
(1) |
0.2 |
- |
- |
- |
0.1 |
| At 31 Dec 2021 |
201,835 |
5,676 |
1,115 |
- |
208,626 |
(52) |
(59) |
(280) |
- |
(391) |
- |
1.0 |
25.1 |
- |
0.2 |
1 Excludes performance guarantee contracts to which the impairment requirements in IFRS 9 are not applied.
2 Represents the maximum amount at risk should the contracts be fully drawn upon and clients default.
3 Purchased or originated credit-impaired ('POCI').
| Stage 2 days past due analysis at 31 December 2021 (continued) |
|||||||||
| (Audited) |
Gross carrying amount |
Allowance for ECL |
ECL coverage % |
||||||
|
|
|
of which: |
of which: |
|
of which: |
of which: |
|
of which: |
of which: |
|
|
Stage 2 |
1 to 29 DPD1 |
30 and > DPD1 |
Stage 2 |
1 to 29 DPD1 |
30 and > DPD1 |
Stage 2 |
1 to 29 DPD1 |
30 and > DPD1 |
| The bank |
£m |
£m |
£m |
£m |
£m |
£m |
% |
% |
% |
| Loans and advances to customers at amortised cost: |
3,197 |
19 |
6 |
(47) |
(1) |
- |
1.5 |
5.3 |
- |
| - Personal |
88 |
19 |
6 |
(2) |
(1) |
- |
2.3 |
5.3 |
- |
| - Corporate and commercial |
2,893 |
- |
- |
(45) |
- |
- |
1.6 |
- |
- |
| - Non-bank financial institutions |
216 |
- |
- |
- |
- |
- |
- |
- |
- |
| Loans and advances to banks at amortised cost |
7 |
- |
- |
(1) |
- |
- |
14.3 |
- |
- |
| Other financial assets measured at amortised cost |
21 |
- |
- |
- |
- |
- |
- |
- |
- |
1 Days past due ('DPD'). Up-to-date accounts in stage 2 are not shown in amounts presented above.
Stage 2 decomposition as at 31 December 2022The following disclosure presents the stage 2 decomposition of gross carrying amount and allowances for ECL for loans and advances to customers. It also sets out the reasons why an exposure is classified as stage 2 and therefore presented as a significant increase in credit risk at 31 December 2022.
The quantitative classification shows gross carrying values and allowances for ECL for which the applicable reporting date PD measure exceeds defined quantitative thresholds for retail and wholesale exposures.
The qualitative classification primarily accounts for credit risk rating ('CRR') deterioration, watch-and-worry and retail management judgemental adjustments.
For further details on our approach to the assessment of significant increase in credit risk, see 'Summary of significant accounting policies' on page 126.
| Loans and advances to customers at 31 December 20221 |
|||||||||
|
|
Gross carrying amount |
Allowance for ECL |
ECL Coverage |
||||||
|
|
Personal |
Corporate and commercial |
Non-bank financial institutions |
Total |
Personal |
Corporate and commercial |
Non-bank financial institutions |
Total |
|
| The group |
£m |
£m |
£m |
£m |
£m |
£m |
£m |
£m |
% |
| Quantitative |
557 |
3,310 |
379 |
4,246 |
(12) |
(71) |
(2) |
(85) |
2.0 |
| Qualitative |
56 |
2,874 |
319 |
3,249 |
(3) |
(51) |
(5) |
(59) |
1.8 |
| 30 DPD backstop2 |
2 |
295 |
25 |
322 |
- |
(1) |
- |
(1) |
0.3 |
| Total stage 2 |
615 |
6,479 |
723 |
7,817 |
(15) |
(123) |
(7) |
(145) |
1.9 |
| The bank |
|
|
|
|
|
|
|
|
|
| Quantitative |
456 |
1,109 |
314 |
1,879 |
(6) |
(13) |
(1) |
(20) |
1.1 |
| Qualitative |
26 |
438 |
233 |
697 |
(1) |
(14) |
- |
(15) |
2.2 |
| 30 DPD backstop2 |
- |
- |
- |
- |
- |
- |
- |
- |
- |
| Total stage 2 |
482 |
1,547 |
547 |
2,576 |
(7) |
(27) |
(1) |
(35) |
1.4 |
1 Where balances satisfy more than one of the above three criteria for determining a significant increase in credit risk, the corresponding gross exposure and ECL have been assigned in order of categories presented.
2 Days past due ('DPD').
| Loans and advances to customers at 31 December 20211 |
|||||||||
|
|
Gross carrying amount |
Allowance for ECL |
ECL |
||||||
|
|
Personal |
Corporate |
Non-bank financial institutions |
Total |
Personal |
Corporate |
Non-bank financial institutions |
Total |
|
| The group |
£m |
£m |
£m |
£m |
£m |
£m |
£m |
£m |
% |
| Quantitative |
561 |
3,611 |
162 |
4,334 |
(13) |
(41) |
(1) |
(55) |
1.3 |
| Qualitative |
102 |
4,260 |
198 |
4,560 |
(2) |
(96) |
(4) |
(102) |
2.2 |
| 30 DPD backstop2 |
23 |
195 |
9 |
227 |
(1) |
- |
- |
(1) |
0.4 |
| Total stage 2 |
686 |
8,066 |
369 |
9,121 |
(16) |
(137) |
(5) |
(158) |
1.7 |
| The bank |
|
|
|
|
|
|
|
|
|
| Quantitative |
26 |
1,731 |
95 |
1,852 |
(2) |
(9) |
- |
(11) |
0.6 |
| Qualitative |
62 |
1,162 |
121 |
1,345 |
- |
(36) |
- |
(36) |
2.7 |
| 30 DPD backstop2 |
- |
- |
- |
- |
- |
- |
- |
- |
- |
| Total stage 2 |
88 |
2,893 |
216 |
3,197 |
(2) |
(45) |
- |
(47) |
1.5 |
1 Where balances satisfy more than one of the above three criteria for determining a significant increase in credit risk, the corresponding gross exposure and ECL have been assigned in order of categories presented.
2 Days past due ('DPD').
Assets held for sale(Audited)
During 2022, gross loans and advances and related impairment allowances were reclassified from 'loans and advances to customers' and 'loans and advances to banks' to 'assets held for sale' in the balance sheet.
At 31 December 2022, the most material balances held for sale came from our retail banking operations France.
Disclosures relating to assets held for sale are provided in the following credit risk tables, primarily where the disclosure is relevant to the measurement of these financial assets:
• Maximum exposure to credit risk (page 47);
• Distribution of financial instruments by credit quality at 31 December (page 57);
Although there was a reclassification on the balance sheet, there was no separate income statement reclassification. As a result, charges for loan impairment losses shown in the credit risk disclosures include loan impairment charges relating to financial assets classified as 'assets held for sale'.
Loans and other credit-related commitments and financial guarantees, as reported in credit disclosures, also include exposures and allowances relating to financial assets classified as 'assets held for sale'.
| Loans and advances to customers and banks measured at amortised cost |
||
| (Audited) |
|
|
|
|
Total gross |
Impairment |
|
|
£m |
£m |
| As reported |
90,869 |
(1,146) |
| Reported in 'Assets held for sale' |
21,325 |
(131) |
| At 31 Dec 2022 |
112,194 |
(1,277) |
Lending balances held for sale continue to be measured at amortised cost less allowances for impairment and, therefore, such carrying amounts may differ from fair value.
These lending balances are part of associated disposal groups that are measured in their entirety at the lower of carrying amount and fair value less costs to sell. Any difference between the carrying amount of these assets and their sales price is part of the overall gain or loss on the associated disposal group as a whole.
For further details of the carrying amount and the fair value at 31 December 2022 of loans and advances to banks and customers classified as held for sale, see note 34.
| Gross loans and impairment allowances on loans and advances to customers and banks reported in 'Assets held for sale' |
|||
| (Audited) |
|
|
|
|
|
Retail banking operations in France |
Other1 |
Total |
| Gross Loans |
£m |
£m |
£m |
| Loans and advances to customers at amortised cost: |
20,852 |
342 |
21,194 |
| Personal |
18,835 |
253 |
19,088 |
| Corporate and Commercial |
1,975 |
89 |
2,064 |
| Non-bank financial institutions |
42 |
- |
42 |
| Loans and advances to banks at amortised cost |
- |
131 |
131 |
| At 31 Dec 2022 |
20,852 |
473 |
21,325 |
| Impairment allowance |
|
|
|
| Loans and advances to customers at amortised cost: |
(76) |
(51) |
(127) |
| Personal |
(73) |
(38) |
(111) |
| Corporate and Commercial |
(3) |
(13) |
(16) |
| Non-bank financial institutions |
- |
- |
- |
| Loans and advances to banks at amortised cost |
- |
(4) |
(4) |
| At 31 Dec 2022 |
(76) |
(55) |
(131) |
1 Comprising assets held for sale relating to the planned sale of our branch operations in Greece and of our business in Russia.
The table below analyses the amount of ECL (charges)/releases arising from assets held for sale. The charges during the period primarily relate to the retail banking operations in France.
| Changes in expected credit losses and other credit impairment |
||
| (Audited) |
|
|
|
|
2022 |
2021 |
|
|
£m |
£m |
| ECL charges arising from: |
|
|
| - Asset held for sale |
4 |
- |
| - Asset not held for sale |
218 |
- |
| At 31 Dec |
222 |
- |
|
|
|
|
Credit exposure
Maximum exposure to credit risk
(Audited)
This section provides information on balance sheet items and their offsets as well as loan and other credit-related commitments. The offset on derivatives remains in line with the movements in maximum exposure amounts.
| 'Maximum exposure to credit risk' table The following table presents our maximum exposure before taking account of any collateral held or other credit enhancements (unless such enhancements meet accounting offsetting requirements). The table excludes financial instruments whose carrying amount best represents the net exposure to credit risk and it excludes equity securities as they are not subject to credit risk. For the financial assets recognised on the balance sheet, the maximum exposure to credit risk equals their carrying amount; for financial guarantees and other guarantees granted, it is the maximum amount that we would have to pay if the guarantees were called upon. For loan commitments and other credit-related commitments, it is generally the full amount of the committed facilities. The offset in the table relates to amounts where there is a legally enforceable right of offset in the event of counterparty default and where, as a result, there is a net exposure for credit risk purposes. However, as there is no intention to settle these balances on a net basis under normal circumstances, they do not qualify for net presentation for accounting purposes. No offset has been applied to off-balance sheet collateral. In the case of derivatives the offset column also includes collateral received in cash and other financial assets. |
Other credit risk mitigants
While not disclosed as an offset in the following 'Maximum exposure to credit risk' table, other arrangements are in place which reduce our maximum exposure to credit risk. These include a charge over collateral on borrowers' specific assets such as residential properties, collateral held in the form of financial instruments that are not held on balance sheet and short positions in securities. In addition, for financial assets held as part of linked insurance/investment contracts the credit risk is predominantly borne by the policyholder. See Note 28 on the financial statements for further details of collateral in respect of certain loans and advances and derivatives.
Collateral available to mitigate credit risk is disclosed in the 'Collateral and other credit enhancement' section on page 69.
| Maximum exposure to credit risk |
|
|
|
|||
| (Audited) |
2022 |
2021 |
||||
|
|
Maximum |
Offset |
Net |
Maximum exposure |
Offset |
Net |
| The group |
£m |
£m |
£m |
£m |
£m |
£m |
| Loans and advances to customers held at amortised cost |
72,614 |
(8,149) |
64,465 |
91,177 |
(7,057) |
84,120 |
| - personal |
5,958 |
(1) |
5,957 |
25,231 |
- |
25,231 |
| - corporate and commercial |
54,067 |
(7,269) |
46,798 |
55,123 |
(6,228) |
48,895 |
| - non-bank financial institutions |
12,589 |
(879) |
11,710 |
10,823 |
(829) |
9,994 |
| Loans and advances to banks at amortised cost |
17,109 |
(145) |
16,964 |
10,784 |
(88) |
10,696 |
| Other financial assets held at amortised cost |
268,023 |
(10,882) |
257,141 |
202,455 |
(10,239) |
192,216 |
| - cash and balances at central banks |
131,433 |
- |
131,433 |
108,482 |
- |
108,482 |
| - items in the course of collection from other banks |
2,285 |
- |
2,285 |
346 |
- |
346 |
| - reverse repurchase agreements - non trading |
53,949 |
(10,882) |
43,067 |
54,448 |
(10,239) |
44,209 |
| - financial investments |
3,248 |
- |
3,248 |
10 |
- |
10 |
| - asset held for sale |
21,214 |
- |
21,214 |
|
|
|
| - other assets |
55,894 |
- |
55,894 |
39,169 |
- |
39,169 |
| Derivatives |
225,238 |
(224,444) |
794 |
141,221 |
(139,668) |
1,553 |
| Total on balance sheet exposure to credit risk |
582,984 |
(243,620) |
339,364 |
445,637 |
(157,052) |
288,585 |
| Total off-balance sheet |
150,270 |
- |
150,270 |
146,261 |
- |
146,261 |
| - financial and other guarantees1 |
22,425 |
- |
22,425 |
26,840 |
- |
26,840 |
| - loan and other credit-related commitments |
127,845 |
- |
127,845 |
119,421 |
- |
119,421 |
| At 31 Dec |
733,254 |
(243,620) |
489,634 |
591,898 |
(157,052) |
434,846 |
| The bank |
|
|
|
|
|
|
| Loans and advances to customers held at amortised cost |
36,992 |
(8,132) |
28,860 |
33,936 |
(7,047) |
26,889 |
| - personal |
3,572 |
- |
3,572 |
3,674 |
- |
3,674 |
| - corporate and commercial |
22,209 |
(7,264) |
14,945 |
20,874 |
(6,224) |
14,650 |
| - non-bank financial institutions |
11,211 |
(868) |
10,343 |
9,388 |
(823) |
8,565 |
| Loans and advances to banks at amortised cost |
14,486 |
- |
14,486 |
6,778 |
- |
6,778 |
| Other financial assets held at amortised cost |
169,367 |
(10,427) |
158,940 |
135,109 |
(9,045) |
126,064 |
| - cash and balances at central banks |
78,441 |
- |
78,441 |
63,008 |
- |
63,008 |
| - items in the course of collection from other banks |
1,863 |
- |
1,863 |
211 |
- |
211 |
| - reverse repurchase agreements - non trading |
43,055 |
(10,427) |
32,628 |
39,708 |
(9,045) |
30,663 |
| - financial investments |
6,378 |
- |
6,378 |
3,337 |
- |
3,337 |
| - other assets |
39,630 |
- |
39,630 |
28,845 |
- |
28,845 |
| Derivatives |
196,714 |
(196,505) |
209 |
125,787 |
(123,964) |
1,823 |
| Total on balance sheet exposure to credit risk |
417,559 |
(215,064) |
202,495 |
301,610 |
(140,056) |
161,554 |
| Total off-balance sheet |
44,673 |
- |
44,673 |
41,034 |
- |
41,034 |
| - financial and other guarantees1 |
8,231 |
- |
8,231 |
8,592 |
- |
8,592 |
| - loan and other credit-related commitments |
36,442 |
- |
36,442 |
32,442 |
- |
32,442 |
| At 31 Dec |
462,232 |
(215,064) |
247,168 |
342,644 |
(140,056) |
202,588 |
1 'Financial and other guarantees' represents 'Financial guarantees' and 'Performance and other guarantees' as disclosed in Note 30, net of ECL.
Concentration of exposure
We have a number of businesses with a broad range of products. We operate in a number of markets with the majority of our exposures in UK and France.
For an analysis of:
• financial investments, see Note 15 on the financial statements;
• trading assets, see Note 10 on the financial statements;
• derivatives, see page 72 and Note 14 on the financial statements; and
• loans and advances by industry sector and by the location of the principal operations of the lending subsidiary or by the location of the lending branch, see page 67 for wholesale lending and page 72 for personal lending.
Credit deterioration of financial instruments
(Audited)
A summary of our current policies and practices regarding the identification, treatment and measurement of stage 1, stage 2 and stage 3 (credit impaired) and POCI financial instruments can be found in Note 1.2 on the financial statements.
| Measurement uncertainty and sensitivity analysis of ECL estimates |
(Audited)
The recognition and measurement of ECL involves the use of significant judgement and estimation. We form multiple economic scenarios based on economic forecasts, apply these assumptions to credit risk models to estimate future credit losses, and probability-weight the results to determine an unbiased ECL estimate. Management judgemental adjustments are used to address late-breaking events, data and model limitations, model deficiencies and expert credit judgements.
Amid a deterioration in the economic and geopolitical environment, management judgements and estimates continued to be subject to a high degree of uncertainty in relation to assessing economic scenarios for impairment allowances in 2022.
Inflation, economic contraction and high interest rates combined with an unstable geopolitical environment and the effects of global supply chain disruptions have contributed to elevated levels of uncertainty during the year.
At 31 December 2022, as a result of this uncertainty, additional stage 1 and 2 impairment allowances were recognised. Management continued to reflect a degree of caution both in the selection of economic scenarios and their weightings, and in the use of management judgemental adjustments, described in more detail below.
At 31 December 2022, there was a reduction in management judgemental adjustments compared with 31 December 2021. Adjustments related to Covid-19 and for sector-specific risks were reduced as scenarios and modelled outcomes better reflected the key risks at 31 December 2022.
Methodology
Four economic scenarios are used to capture the current economic environment and to articulate management's view of the range of potential outcomes. Scenarios produced to calculate ECL are aligned to HSBC's top and emerging risks.
Three of the scenarios are drawn from consensus forecasts and distributional estimates. The Central scenario is deemed the 'most likely' scenario, and usually attracts the largest probability weighting, while the outer scenarios represent the tails of the distribution, which are less likely to occur. The Central scenario is created using the average of a panel of external forecasters. Consensus Upside and Downside scenarios are created with reference to distributions for select markets that capture forecasters' views of the entire range of outcomes. In the later years of the scenarios, projections revert to long-term consensus trend expectations. In the consensus outer scenarios, reversion to trend expectations is done mechanically with reference to historically observed quarterly changes in the values of macroeconomic variables.
The fourth scenario, Downside 2, is designed to represent management's view of severe downside risks. It is a globally consistent narrative-driven scenario that explores more extreme economic outcomes than those captured by the consensus scenarios. In this scenario, variables do not, by design, revert to long-term trend expectations. They may instead explore alternative states of equilibrium, where economic activity moves permanently away from past trends. The consensus Downside and the consensus Upside scenarios are each constructed to be consistent with a 10% probability. The Downside 2 is constructed with a 5% probability. The Central scenario is assigned the remaining 75%. This weighting scheme is deemed appropriate for the unbiased estimation of ECL in most circumstances. However, management may depart from this probability-based scenario weighting approach when the economic outlook is determined to be particularly uncertain and risks are elevated.
In light of ongoing risks, management deviated from this probability weighting in the fourth quarter of 2022, and assigned additional weight to outer scenarios.
Description of economic scenarios
The economic assumptions presented in this section have been formed by HSBC with reference to external forecasts specifically for the purpose of calculating ECL.
Economic forecasts remain subject to a high degree of uncertainty. Upside and Downside scenarios are constructed so that they encompass the potential crystallisation of a number of key macro-financial risks.
At the end of 2022, risks to the economic outlook included the persistence of inflation and its consequences on monetary policy. Rapid changes to public policy also increased forecast uncertainty.
In Europe, risks relating to energy pricing and supply security remain significant. Geopolitical risks also remain significant and include the possibility of a prolonged and escalating Russia-Ukraine war, continued disagreements between the US and other countries with China over a range of economic and strategic issues, and the evolution of the UK's relationship with the EU.
Economic forecasts for our main markets deteriorated in the fourth quarter as GDP growth slowed. In Europe high inflation and rising interest rates have reduced real household incomes and raised business costs, dampening consumption and investment and lowering growth expectations. The effects of higher interest rate expectations and lower growth are evident in asset price expectations, with house prices forecasts, in particular, significantly lower.
The scenarios used to calculate ECL in the Annual Report and Accounts 2022 are described below.
The consensus Central scenario
HSBC's Central scenario reflects a low growth and higher inflation environment across many of our key markets. The scenario features an initial period of below-trend GDP growth in most of our main markets as higher inflation and tighter monetary policy causes a squeeze on business margins and households' real disposable income. Growth returns to its long term expected trend in later years as central banks bring inflation back to target.
Our Central scenario assumes that inflation peaked in most of our key markets at the end of 2022 but remains high through 2023 before moderating as energy prices stabilise and supply chain disruptions abate. Central banks are expected to keep raising interest rates until midway through 2023. Inflation is forecast to revert to target in most markets, by early 2024.
Global GDP is expected to grow by 1.6% in 2023 in the Central scenario and the average rate of global GDP growth is 2.5% over the five-year forecast period. This is below the average growth rate over the five-year period prior to the onset of the pandemic.
The key features of our Central scenario are:
• Economic activity in European and North American markets continues to weaken. Most major economies are forecast to grow in 2023, but at very low rates. Hong Kong and mainland China are expected to see a recovery in economic activity from 2023 as Covid-19 related restrictions are lifted.
• In most markets, unemployment rises moderately from historic lows as economic activity slows. Labour markets remain fairly tight across our key markets.
• Inflation is expected to remain elevated across many of our key markets driven by energy and food prices. Inflation is subsequently expected to converge back towards central banks target rate over the next two years of the forecast.
• Policy interest rates in key markets will continue to rise in the near term but at a slower pace. Interest rates will stay elevated but start to ease as inflation returns to target.
• The West Texas Intermediate oil price is forecast to average $72 per barrel over the projection period.
The Central scenario was first created with forecasts available in November, and reviewed continuously until late December. Probability weights assigned to the Central scenario are 60% for UK and France.
The following table describes key macroeconomic variables and the probabilities assigned in the consensus Central scenario.
| Central scenario 2023-2027 |
||
|
|
UK |
France |
|
|
% |
% |
| GDP growth rate |
|
|
| 2023: Annual average growth rate |
(0.8) |
0.2 |
| 2024: Annual average growth rate |
1.3 |
1.6 |
| 2025: Annual average growth rate |
1.7 |
1.5 |
| 5-year average |
1.1 |
1.2 |
| Unemployment rate |
|
|
| 2023: Annual average rate |
4.4 |
7.6 |
| 2024: Annual average rate |
4.6 |
7.5 |
| 2025: Annual average rate |
4.3 |
7.3 |
| 5-year average |
4.3 |
7.3 |
| House price growth |
|
|
| 2023: Annual average growth rate |
0.2 |
1.8 |
| 2024: Annual average growth rate |
(3.8) |
2.0 |
| 2025: Annual average growth rate |
0.7 |
3.1 |
| 5-year average |
0.4 |
2.8 |
| Inflation rate |
|
|
| 2023: Annual average rate |
6.9 |
4.6 |
| 2024: Annual average rate |
2.5 |
2.0 |
| 2025: Annual average rate |
2.1 |
1.8 |
| 5-year average |
3.1 |
2.4 |
| Probability |
60.0 |
60.0 |
The graphs compare the respective Central scenario at the year end 2021 with current economic expectations at the end of 2022.
GDP growth: Comparison
UK
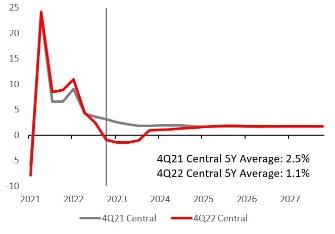
Note: Real GDP shown as year-on-year percentage change.
France
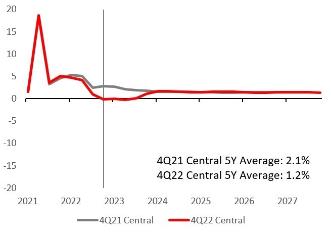
Note: Real GDP shown as year-on-year percentage change.
The consensus Upside scenario
Compared with the Central scenario, the consensus Upside scenario features stronger economic activity in the near term, before converging to long-run trend expectations. It also incorporates a faster fall in the rate of inflation than incorporated in the Central scenario.
The scenario is consistent with a number of key upside risk themes. These include faster resolution of supply chain issues; a rapid conclusion to the Russia-Ukraine war; de-escalation of tensions between the US and China; relaxation of Covid-19 policies in Asia; and improved relations between the UK and the EU.
The following table describes key macroeconomic variables and the probabilities assigned in the consensus Upside scenario.
| Consensus Upside scenario 'best outcome' |
||||
|
|
UK |
France |
||
|
|
% |
|
% |
|
| GDP growth rate |
4.4 |
(4Q24) |
3.1 |
(1Q24) |
| Unemployment rate |
3.5 |
(4Q23) |
6.5 |
(4Q24) |
| House price growth |
4.2 |
(1Q23) |
3.7 |
(1Q23) |
| Inflation rate |
0.7 |
(1Q24) |
0.8 |
(4Q23) |
| Probability |
5 |
5 |
||
Note: Extreme point in the consensus Upside is 'best outcome' in the scenario, for example the highest GDP growth and the lowest unemployment rate, in the first two years of the scenario. The date on which the extreme is reached is indicated in parenthesis. For inflation, lower inflation is interpreted as the 'best' outcome.
Downside scenarios
Downside scenarios explore the intensification and crystallisation of a number of key economic and financial risks.
High inflation and the tighter monetary policy response have become key concerns for global growth. In the downside scenarios, supply chain disruptions intensify, exacerbated by an escalation in the spread of Covid-19 and rising geopolitical tensions drive inflation higher.
There also remains a risk that energy and food prices rise further due to the Russia-Ukraine war, increasing pressure on household budgets and firms' costs.
The possibility of inflation expectations becoming detached from central bank targets also remains a risk. A wage-price spiral triggered by higher inflation and pandemic related labour supply shortages across could put sustained upward pressure on wages, aggravating cost pressures and the squeeze on household real incomes and corporate margins. In turn, it raises the risk of a more forceful policy response from central banks, a steeper trajectory for interest rates and ultimately, deep economic recession.
The risks relating to Covid-19 are centred on the emergence of a new variant with greater vaccine resistance that necessitates a stringent public health policy. In Asia, with the reopening of China in December, management of Covid-19 remains a key source of uncertainty, with the rapid spread of the virus posing a heightened risk of a new variant emerging.
The geopolitical environment also presents risks, including:
• a prolonged Russia-Ukraine war with escalation beyond Ukraine's borders;
• the deterioration of the trading relationship between the UK and the EU over the Northern Ireland Protocol; and
• continued differences between the US and other countries with China, which could affect sentiment and restrict global economic activity.
The consensus Downside scenario
In the consensus Downside scenario, economic activity is considerably weaker compared with the Central scenario. In this scenario, GDP growth weakens below the Central scenario, unemployment rates rise and asset prices fall.
The scenario features a temporary supply side shock that keeps inflation higher than the baseline, before the effects of weaker demand begin to dominate leading to a fall in commodity prices and to lower inflation.
The following table describes key macroeconomic variables and the probabilities assigned in the consensus Downside scenario.
| Consensus Downside scenario 'worst outcome' |
||||
|
|
UK |
France |
||
|
|
% |
|
% |
|
| GDP growth rate |
(3.5) |
(3Q23) |
(1.4) |
(3Q23) |
| Unemployment rate |
5.8 |
(2Q24) |
8.8 |
(4Q23) |
| House price growth |
(10.1) |
(2Q24) |
(0.6) |
(4Q23) |
| Inflation rate (min) |
(0.4) |
(4Q24) |
0.3 |
(4Q24) |
| Inflation rate (max) |
10.8 |
(1Q23) |
7.2 |
(1Q23) |
| Probability |
25 |
25 |
||
Note: Extreme point in the consensus Downside is 'worst outcome' in the scenario, for example lowest GDP growth and the highest unemployment rate, in the first two years of the scenario. The date on which the extreme is reached is indicated in parenthesis. Due to the nature of the shock to inflation in the downside scenarios, both the lowest and the highest point is shown in the tables.
Downside 2 scenario
The Downside 2 scenario features a deep global recession and reflects management's view of the tail of the economic distribution. It incorporates the crystallisation of a number of risks simultaneously, including further escalation of the Russia-Ukraine war, worsening of supply chain disruptions and the emergence of a vaccine-resistant Covid-19 variant that necessitates a stringent public health policy response globally.
This scenario features an initial supply-side shock that pushes up inflation and interest rates higher. This impulse is expected to prove short lived as a large downside demand pressure causes commodity prices to correct sharply and global price inflation to fall as a severe and prolonged recession takes hold.
The following table describes key macroeconomic variables and the probabilities assigned in the Downside 2 scenario.
| Downside 2 scenario 'worst outcome' |
||||
|
|
UK |
France |
||
|
|
% |
|
% |
|
| GDP growth rate |
(6.9) |
(3Q23) |
(6.8) |
(4Q23) |
| Unemployment rate |
8.7 |
(2Q24) |
10.3 |
(4Q24) |
| House price growth |
(22.9) |
(2Q24) |
(6.4) |
(2Q24) |
| Inflation rate (min) |
(2.3) |
(2Q24) |
(2.5) |
(2Q24) |
| Inflation rate (max) |
13.5 |
(2Q23) |
10.4 |
(2Q23) |
| Probability |
10 |
10 |
||
Note: Extreme point in the Downside 2 is 'worst outcome' in the scenario, for example lowest GDP growth and the highest unemployment rate, in the first two years of the scenario. The date on which the extreme is reached is indicated in parenthesis. Due to the nature of the shock to inflation in the downside scenarios, both the lowest and the highest point is shown in the tables.
Scenario weighting
In reviewing the economic conjuncture, the level of uncertainty and risk, management has considered both global and country-specific factors. This has led management to assign scenario probabilities that are tailored to its view of uncertainty in individual markets.
Key consideration around uncertainty attached to the Central scenario projections focused on:
• the progression of the Covid-19 pandemic in Asian countries and announcement of removal of Covid-19 measures and travel restrictions in mainland China and Hong Kong;
• further tightening of monetary policy and impact on borrowing costs in interest rate sensitive sectors, such as housing;
• the risks to gas supply security in Europe and subsequent impact on inflation and commodity prices and growth; and
• the ongoing risks to global supply chains.
In the UK, the surge in price inflation and a squeeze on household real incomes have led to strong monetary policy responses from central bank. Higher interest rates have increased recession risks and the prospects for outright decline in house prices.
The UK faces additional challenges from the rise in energy prices and accompanying deterioration in the terms of trade. For the UK, the consensus Upside and Central scenarios had a combined weighting of 65%.
In France, uncertainties around the outlook remain elevated due to high inflation and Europe's exposure to the Russia-Ukraine war through the economic costs incurred from the imposition of sanctions, trade disruption and energy dependence on Russia. The consensus Upside and Central scenarios had a combined weighting of 65%.
The following graphs show the historical and forecasted GDP growth rate for the various economic scenarios in UK and France.
UK
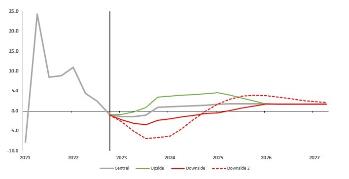
France
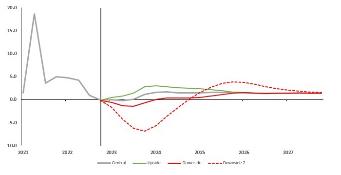
Critical accounting estimates and judgements
The calculation of ECL under IFRS 9 involves significant judgements, assumptions and estimates. The level of estimation uncertainty and judgement has remained elevated since 31 December 2021, including judgements relating to:
• the selection and weighting of economic scenarios, given rapidly changing economic conditions and a wide dispersion of economic forecasts. There is judgement in making assumptions about the effects of inflation and interest, global growth, supply chain disruption; and
• estimating the economic effects of those scenarios on ECL, particularly as the historical relationship between macroeconomic variables and defaults might not reflect the dynamics of current macroeconomic conditions.
How economic scenarios are reflected in ECL calculations
Models are used to reflect economic scenarios on ECL estimates. As described above, modelled assumptions and linkages based on historical information could not alone produce relevant information under the conditions experienced in 2022, and management judgemental adjustments were still required to support modelled outcomes.
We have developed globally consistent methodologies for the application of forward economic guidance into the calculation of ECL for wholesale and retail credit risk.
These standard approaches are described below, followed by the management judgemental adjustments made, including those to reflect the circumstances experienced in 2022.
For our wholesale portfolios, a global methodology is used for the estimation of the term structure of probability of default ('PD') and loss given default ('LGD'). For PDs, we consider the correlation of forward economic guidance to default rates for a particular industry in a country. For LGD calculations, we consider the correlation of forward economic guidance to collateral values and realisation rates for a particular country and industry. PDs and LGDs are estimated for the entire term structure of each instrument.
For impaired loans, LGD estimates take into account independent recovery valuations provided by external consultants where available or internal forecasts corresponding to anticipated economic conditions and individual company conditions. In estimating the ECL on impaired loans that are individually considered not to be significant, we incorporate forward economic guidance proportionate to the probability-weighted outcome and the Central scenario outcome of the performing population.
For our retail portfolios, the impact of economic scenarios on PD is modelled at a portfolio level. Historical relationships between observed default rates and macroeconomic variables are integrated into IFRS 9 ECL estimates by using economic response models. The impact of these scenarios on PD is modelled over a period equal to the remaining maturity of the underlying asset or assets. The impact on LGD is modelled for mortgage portfolios by forecasting future loan-to-value ('LTV') profiles for the remaining maturity of the asset by using national level forecasts of the house price index and applying the corresponding LGD expectation.
These models are based largely on historical observations and correlations with default rates. Management judgemental adjustments are described below.
Management judgemental adjustments
In the context of IFRS 9, management judgemental adjustments are short-term increases or decreases to the ECL at either a customer, segment or portfolio level to account for late-breaking events, model and data limitations and deficiencies, and expert credit judgement applied following management review and challenge.
This includes refining model inputs and outputs and using adjustments to ECL based on management judgement and higher-level quantitative analysis for impacts that are difficult to model.
The effects of management judgemental adjustments are considered for balances and ECL when determining whether or not a significant increase in credit risk has occurred and are attributed or allocated to a stage as appropriate. This is in accordance with the internal adjustments framework.
Management judgemental adjustments are reviewed under the governance process for IFRS 9 (as detailed in the section 'Credit risk management' on page 36). Review and challenge focuses on the rationale and quantum of the adjustments with a further review carried out by the second line of defence where significant. For some management judgemental adjustments, internal frameworks establish the conditions under which these adjustments should no longer be required and as such are considered as part of the governance process. This internal governance process allows management judgemental adjustments to be reviewed regularly and, where possible, to reduce the reliance on these through model recalibration or redevelopment, as appropriate.
The drivers of management judgemental adjustments continue to evolve with the economic environment and as new risks emerge.
Management judgemental adjustments made in estimating the scenario-weighted reported ECL at 31 December 2022 are set out in the following table.
| Management judgemental adjustments to ECL at 31 December 20221 |
|||
|
|
Retail |
Wholesale |
Total |
|
|
£m |
£m |
£m |
| Banks, sovereigns, government entities and low-risk counterparties |
(16) |
(2) |
(18) |
| Corporate lending adjustments |
- |
(100) |
(100) |
| Retail lending Inflation-related adjustments |
8 |
- |
8 |
| Other macroeconomic-related adjustments |
3 |
- |
3 |
| Pandemic-related economic recovery adjustments |
- |
- |
- |
| Other retail lending adjustments |
7 |
- |
7 |
| Total |
2 |
(102) |
(100) |
| Management judgemental adjustments to ECL at 31 December 2021 |
|||
|
|
Retail |
Wholesale |
Total |
|
|
£m |
£m |
£m |
| Low-risk counterparties (banks,sovereigns and government entities) |
- |
(4) |
(4) |
| Corporate lending adjustments |
- |
31 |
31 |
| Retail lending probability of default adjustments |
- |
- |
- |
| Retail model default timing adjustments |
- |
- |
- |
| Macroeconomic-related adjustments |
17 |
- |
17 |
| Pandemic-related economic recovery adjustments |
3 |
- |
3 |
| Other retail lending adjustments |
- |
- |
- |
| Total |
20 |
27 |
47 |
1 Management judgemental adjustments presented in the table reflect increases or (decreases) to ECL, respectively.
Management judgemental adjustments at 31 December 2022 were a decrease to ECL of £102m for the wholesale portfolio and an increase to ECL of £2m for the retail portfolio.
During 2022, management judgemental adjustments reflected an evolving macroeconomic outlook and the relationship of the modelled ECL to this outlook and to late-breaking and sector-specific risks.
At 31 December 2022, wholesale management judgemental adjustments were an ECL decrease of £102m (31 December 2021: £27m increase).
• Adjustments relating to low credit-risk exposures decreased ECL by £2m at 31 December 2022 (31 December 2021: £4m decrease). The adjustments mainly relate to standard, monthly adjustments for bank and sovereign exposures secured by Export Credit Agency guarantees; the benefit from which is not recognised in the inbound data. The reduction in ECL for these exposures was mostly offset by a management overlay on a Russian Bank exposure due to sanctions. Total net adjustments are broadly flat in comparison to 31 December 2021.
• Adjustments to corporate exposures decreased ECL by £100m at 31 December 2022 (31 December 2021: £31m increase). The adjustments mainly relate to standard, monthly adjustments for corporate exposures secured by Export Credit Agency guarantees and government Covid-19 guarantees; the benefit from which is not recognised in the inbound data. The reduction in ECL for these exposures has been partially offset by management overlays to reflect increased risk on an individual exposure in France and increased risk on certain sub-sectors within France. In comparison to December 2021, the level of management overlay has significantly reduced as modelled results increasingly reflect the macroeconomic environment and portfolio risk, resulting in a net underlay rather than overlay.
At 31 December 2022, retail management judgemental adjustments were an ECL increase of £2m (31 December 2021: £20m increase).
• Retail lending inflation-related adjustments increased ECL by £8m (31 December 2021: nil). These adjustments addressed where increasing inflation and interest rates results in affordability risks which were not fully captured by the modelled output.
• Other macroeconomic-related adjustments increased ECL by £3m (31 December 2021: £17m increase). These adjustments were primarily in relation to country-specific risks related to future macroeconomic conditions.
• Banks, sovereigns, government entities and low-risk counterparties adjustments decreased ECL by £16m (31 December 2021: nil). These adjustments related to the re-alignment of PD between reporting and origination date for certain parts of the portfolio.
• Other retail lending adjustments increased ECL by £7m (31 December 2021: nil), reflecting all other data, model and management judgemental adjustments.
• Pandemic-related economic recovery adjustments were removed during 2022 as scenarios stabilised.
Economic scenarios sensitivity analysis of ECL estimates
Management considered the sensitivity of the ECL outcome against the economic forecasts as part of the ECL governance process by recalculating the ECL under each scenario described above for selected portfolios, applying a 100% weighting to each scenario in turn. The weighting is reflected in both the determination of a significant increase in credit risk and the measurement of the resulting ECL.
The ECL calculated for the Upside and Downside scenarios should not be taken to represent the upper and lower limits of possible ECL outcomes. The impact of defaults that might occur in the future under different economic scenarios is captured by recalculating ECL for loans at the balance sheet date.
There is a particularly high degree of estimation uncertainty in numbers representing more severe risk scenarios when assigned a 100% weighting.
For wholesale credit risk exposures, the sensitivity analysis excludes ECL and financial instruments related to defaulted (stage 3) obligors. It is generally impracticable to separate the effect of macroeconomic factors in individual assessments of obligors in default. The measurement of stage 3 ECL is relatively more sensitive to credit factors specific to the obligor than future economic scenarios, and loans to defaulted obligors are a small portion of the overall wholesale lending exposure, even if representing the majority of the allowance for ECL. Therefore, the sensitivity analysis to macroeconomic scenarios does not capture the residual estimation risk arising from wholesale stage 3 exposures. Due to the range and specificity of the credit factors to which the ECL is sensitive, it is not possible to provide a meaningful alternative sensitivity analysis for a consistent set of risks across all defaulted obligors.
For retail credit risk exposures, the sensitivity analysis includes ECL for loans and advances to customers related to defaulted obligors. This is because the retail ECL for secured mortgage portfolios including loans in all stages is sensitive to macroeconomic variables.
Wholesale and retail sensitivity
The wholesale and retail sensitivity tables present the 100% weighted results. These exclude portfolios held by the insurance business and small portfolios, and as such cannot be directly compared with personal and wholesale lending presented in other credit risk tables. Additionally, in both the wholesale and retail analysis, the comparative period results for Downside 2 scenarios are also not directly comparable with the current period, because they reflect different risk profiles relative to the consensus scenarios for the period end.
The wholesale and retail sensitivity analysis is stated inclusive of management judgmental adjustments, as appropriate to each scenario.
Wholesale analysis
| IFRS 9 ECL sensitivity to future economic conditions1,2,3
|
||
|
|
UK |
France |
|
|
£m |
£m |
| ECL of loans and advances to customers at |
|
|
| Reported ECL |
84 |
94 |
| Consensus scenarios |
|
|
| Central scenario |
64 |
87 |
| Upside scenario |
51 |
77 |
| Downside scenario |
91 |
104 |
| Downside 2 scenario |
271 |
124 |
| Gross carrying amount2 |
143,037 |
148,417 |
| IFRS 9 ECL sensitivity to future economic conditions |
||
|
|
UK |
France |
|
|
£m |
£m |
| ECL of loans and advances to customers at |
|
|
| Reported ECL |
104 |
98 |
| Consensus scenarios |
|
|
| Central scenario |
90 |
89 |
| Upside scenario |
71 |
78 |
| Downside scenario |
109 |
120 |
| Downside 2 scenario |
189 |
138 |
| Gross carrying amount2 |
142,450 |
120,955 |
1 ECL sensitivity includes off-balance sheet financial instruments that are subject to significant measurement uncertainty.
2 Includes low credit-risk financial instruments such as debt instruments at FVOCI, which have high carrying amounts but low ECL under all the above scenarios.
3 Excludes defaulted obligors. For a detailed breakdown of performing and non-performing wholesale portfolio exposures, see page 67.
Retail analysis
| IFRS 9 ECL sensitivity to future economic conditions1 |
||
|
|
UK |
France2 |
|
|
£m |
£m |
| ECL of loans and advances to customers at 31 December 2022 |
|
|
| Reported ECL |
7 |
87 |
| Consensus scenarios |
|
|
| Central scenario |
6 |
86 |
| Upside scenario |
6 |
84 |
| Downside scenario |
7 |
88 |
| Downside 2 scenario |
12 |
92 |
| Gross carrying amount |
2,037 |
18,987 |
| IFRS 9 ECL sensitivity to future economic conditions1 |
||
|
|
UK |
France |
|
|
£m |
£m |
| ECL of loans and advances to customers at |
|
|
| Reported ECL |
5 |
91 |
| Consensus scenarios |
|
|
| Central scenario |
4 |
91 |
| Upside scenario |
4 |
91 |
| Downside scenario |
5 |
92 |
| Downside 2 scenario |
10 |
93 |
| Gross carrying amount |
2,007 |
18,295 |
1 ECL sensitivities exclude portfolios utilising less complex modelling approaches.
2 Includes balances and ECL which have been reclassified from 'loans and advances to customers' to 'assets held for sale' in the balance sheet. This also includes any balances and ECL which continue to be reported as personal lending in 'loans and advances to customers' that are in accordance with the basis of inclusion for Retail sensitivity analysis.
RNS may use your IP address to confirm compliance with the terms and conditions, to analyse how you engage with the information contained in this communication, and to share such analysis on an anonymised basis with others as part of our commercial services. For further information about how RNS and the London Stock Exchange use the personal data you provide us, please see our Privacy Policy.