Reconciliation of changes in gross carrying/nominal amount and allowances for loans and advances to banks and customers including loan commitments and financial guarantees
The following disclosure provides a reconciliation by stage of the group's gross carrying/nominal amount and allowances for loans and advances to banks and customers, including loan commitments and financial guarantees. Movements are calculated on a quarterly basis and therefore fully capture stage movements between quarters. If movements were calculated on a year-to-date basis they would only reflect the opening and closing position of the financial instrument.
The transfers of financial instruments represent the impact of stage transfers upon the gross carrying/nominal amount and associated allowance for ECL.
The net remeasurement of ECL arising from stage transfers represents the increase or decrease due to these transfers, for example, moving from a 12-month (stage 1) to a lifetime (stage 2) ECL measurement basis. Net remeasurement excludes the underlying customer risk rating ('CRR')/probability of default ('PD') movements of the financial instruments transferring stage. This is captured, along with other credit quality movements in the 'changes in risk parameters - credit quality' line item.
Changes in 'New financial assets originated or purchased', 'Assets derecognised (including final repayments)' and 'Changes to risk parameters - further lending/repayments' represent the impact from volume movements within the group's lending portfolio.
| Reconciliation of changes in gross carrying/nominal amount and allowances for loans and advances to banks and customers including loan commitments and financial guarantees1 |
||||||||||
| (Audited) |
||||||||||
|
|
Non credit - impaired |
Credit - impaired |
|
|||||||
|
|
Stage 1 |
Stage 2 |
Stage 3 |
POCI |
Total |
|||||
|
|
Gross carrying/nominal amount |
Allowance for ECL |
Gross carrying/ nominal amount |
Allowance for ECL |
Gross carrying/ nominal amount |
Allowance for ECL |
Gross carrying/ nominal amount |
Allowance for ECL |
Gross carrying/nominal amount |
Allowance for ECL |
| The group |
£m |
£m |
£m |
£m |
£m |
£m |
£m |
£m |
£m |
£m |
| At 1 Jan 2022 |
179,612 |
(118) |
17,471 |
(188) |
2,779 |
(923) |
2 |
(2) |
199,864 |
(1,231) |
| Transfers of financial instruments |
(14,449) |
(26) |
13,625 |
59 |
824 |
(33) |
- |
- |
- |
- |
| - transfers from stage 1 to stage 2 |
(25,027) |
15 |
25,027 |
(15) |
- |
- |
- |
- |
- |
- |
| - transfers from stage 2 to stage 1 |
10,847 |
(42) |
(10,847) |
42 |
- |
- |
- |
- |
- |
- |
| - transfers to stage 3 |
(340) |
2 |
(600) |
35 |
940 |
(37) |
- |
- |
- |
- |
| - transfers from stage 3 |
71 |
(1) |
45 |
(3) |
(116) |
4 |
- |
- |
- |
- |
| Net remeasurement of ECL arising from transfer of stage |
- |
29 |
- |
(24) |
- |
(10) |
- |
- |
- |
(5) |
| New financial assets originated or purchased |
47,763 |
(30) |
- |
- |
- |
- |
- |
- |
47,763 |
(30) |
| Asset derecognised (including final repayments) |
(27,882) |
4 |
(2,625) |
13 |
(442) |
110 |
- |
- |
(30,949) |
127 |
| Changes to risk parameters - further lending/repayments |
(9,969) |
33 |
(8,645) |
16 |
(261) |
(20) |
1 |
- |
(18,874) |
29 |
| Changes to risk parameters - credit quality |
- |
32 |
- |
(101) |
- |
(318) |
- |
2 |
- |
(385) |
| Changes to model used for ECL calculation |
- |
4 |
- |
10 |
- |
- |
- |
- |
- |
14 |
| Assets written off |
- |
- |
- |
- |
(165) |
165 |
- |
- |
(165) |
165 |
| Credit related modifications that resulted in derecognition |
- |
- |
- |
- |
(1) |
1 |
- |
- |
(1) |
1 |
| Foreign exchange |
5,764 |
(3) |
744 |
(11) |
88 |
(34) |
- |
- |
6,596 |
(48) |
| Others2,3 |
(12,468) |
4 |
(2,511) |
26 |
(286) |
100 |
- |
- |
(15,265) |
130 |
| At 31 Dec 2022 |
168,371 |
(71) |
18,059 |
(200) |
2,536 |
(962) |
3 |
- |
188,969 |
(1,233) |
| ECL income statement change for the period |
|
72 |
|
(86) |
|
(238) |
|
2 |
|
(250) |
| Recoveries |
|
|
|
|
|
|
|
|
|
2 |
| Others |
|
|
|
|
|
|
|
|
|
28 |
| Total ECL income statement change for the period |
|
|
|
|
|
|
|
|
|
(220) |
| Reconciliation of changes in gross carrying/nominal amount and allowances for loans and advances to banks and customers including loan commitments and financial guarantees1 (continued) |
|||
| (Audited) |
|||
|
|
At 31 Dec 2022 |
12 months ended 31 Dec 2022 |
|
|
|
Gross carrying/nominal amount |
Allowance for ECL |
ECL release/(charge) |
| |
£m |
£m |
£m |
| As above |
188,969 |
(1,233) |
(220) |
| Other financial assets measured at amortised cost |
269,755 |
(137) |
(3) |
| Non-trading reverse purchase agreement commitments |
33,684 |
- |
- |
| Performance and other guarantees not considered for IFRS 9 |
|
|
6 |
| Summary of financial instruments to which the impairment requirements in IFRS 9 are applied/Summary consolidated income statement |
492,408 |
(1,370) |
(217) |
| Debt instruments measured at FVOCI |
29,248 |
(24) |
(5) |
| Total allowance for ECL/total income statement ECL change for the period |
N/A |
(1,394) |
(222) |
1 Excludes performance guarantee contracts to which the impairment requirements in IFRS 9 are not applied.
2 Includes the period on period movement in exposures relating to other HSBC Group companies. As at 31 December 2022, these amounted to £4bn and were classified as stage 1 with no ECL.
3 Total includes £21bn of gross carrying loans and advances to customers and banks, which were classified to assets held for sale and a corresponding allowance for ECL of £131m reflecting business disposals as disclosed in Note 34 'Assets held for sale and liabilities of disposal groups held for sale' on page 186.
| Reconciliation of changes in gross carrying/nominal amount and allowances for loans and advances to banks and customers including loan commitments and financial guarantees1 (continued) |
||||||||||
| (Audited) |
||||||||||
|
|
Non credit - impaired |
Credit - impaired |
|
|||||||
|
|
Stage 1 |
Stage 2 |
Stage 3 |
POCI |
Total |
|||||
|
|
Gross carrying/nominal amount |
Allowance for ECL |
Gross carrying/ nominal amount |
Allowance for ECL |
Gross carrying/ nominal amount |
Allowance for ECL |
Gross carrying/ nominal amount |
Allowance for ECL |
Gross carrying/nominal amount |
Allowance for ECL |
| The group |
£m |
£m |
£m |
£m |
£m |
£m |
£m |
£m |
£m |
£m |
| At 1 Jan 2021 |
184,715 |
(180) |
31,726 |
(378) |
3,352 |
(1,050) |
40 |
(12) |
219,833 |
(1,620) |
| Transfers of financial instruments: |
5,245 |
(66) |
(5,617) |
90 |
372 |
(24) |
- |
- |
- |
- |
| - transfers from stage 1 to stage 2 |
(8,431) |
14 |
8,431 |
(14) |
- |
- |
- |
- |
- |
- |
| - transfers from stage 2 to stage 1 |
13,714 |
(78) |
(13,714) |
78 |
- |
- |
- |
- |
- |
- |
| - transfers to stage 3 |
(93) |
- |
(401) |
28 |
494 |
(28) |
- |
- |
- |
- |
| - transfers from stage 3 |
55 |
(2) |
67 |
(2) |
(122) |
4 |
- |
- |
- |
- |
| Net remeasurement of ECL arising from transfer of stage |
- |
43 |
- |
(22) |
- |
(5) |
- |
- |
- |
16 |
| New financial assets originated or purchased |
72,348 |
(55) |
- |
- |
- |
- |
- |
- |
72,348 |
(55) |
| Asset derecognised (including final repayments) |
(57,098) |
6 |
(3,481) |
32 |
(454) |
95 |
(3) |
2 |
(61,036) |
135 |
| Changes to risk parameters - further lending/repayments |
(16,766) |
76 |
(3,927) |
62 |
(213) |
40 |
(29) |
2 |
(20,935) |
180 |
| Changes to risk parameters - credit quality |
- |
54 |
- |
7 |
- |
(176) |
- |
- |
- |
(115) |
| Changes to model used for ECL calculation |
- |
2 |
- |
9 |
- |
- |
- |
- |
- |
11 |
| Assets written off |
- |
- |
- |
- |
(152) |
152 |
(5) |
5 |
(157) |
157 |
| Credit related modifications that resulted in derecognition |
- |
- |
- |
- |
- |
- |
- |
- |
- |
- |
| Foreign exchange |
(7,512) |
2 |
(1,060) |
10 |
(126) |
46 |
(1) |
1 |
(8,699) |
59 |
| Others2 |
(1,320) |
- |
(170) |
2 |
- |
(1) |
- |
- |
(1,490) |
1 |
| At 31 Dec 2021 |
179,612 |
(118) |
17,471 |
(188) |
2,779 |
(923) |
2 |
(2) |
199,864 |
(1,231) |
| ECL Income statement change for the period |
|
126 |
|
88 |
|
(46) |
|
4 |
|
172 |
| Recoveries |
|
|
|
|
|
|
|
|
|
3 |
| Others |
|
|
|
|
|
|
|
|
|
(23) |
| Total ECL income statement change for the period |
|
|
|
|
|
|
|
|
|
152 |
| Reconciliation of changes in gross carrying/nominal amount and allowances for loans and advances to banks and customers including loan commitments and financial guarantees1 (continued) |
|||
| (Audited) |
|||
|
|
At 31 Dec 2021 |
12 months ended 31 Dec 2021 |
|
|
|
Gross carrying/ |
Allowance for ECL |
ECL release |
| |
£m |
£m |
£m |
| As above |
199,864 |
(1,231) |
152 |
| Other financial assets measured at amortised cost |
202,137 |
(9) |
(1) |
| Non-trading reverse purchase agreement commitments |
30,005 |
- |
- |
| Performance and other guarantees not considered for IFRS 9 |
0 |
0 |
18 |
| Summary of financial instruments to which the impairment requirements in IFRS 9 are applied/Summary consolidated income statement |
432,006 |
(1,240) |
169 |
| Debt instruments measured at FVOCI |
41,188 |
(19) |
5 |
| Total allowance for ECL/total income statement ECL change for the period |
N/A |
(1,259) |
174 |
1 Excludes performance guarantee contracts to which the impairment requirements in IFRS 9 are not applied.
2 Includes the period on period movement in exposures relating to other HSBC Group companies. As at 31 December 2021, these amounted to £(1)bn and were classified as stage 1 with no ECL.
| Reconciliation of changes in gross carrying/nominal amount and allowances for loans and advances to banks and customers including loan commitments and financial guarantees1 |
||||||||||
| (Audited) |
||||||||||
|
|
Non credit - impaired |
Credit - impaired |
|
|||||||
|
|
Stage 1 |
Stage 2 |
Stage 3 |
POCI |
Total |
|||||
|
|
Gross carrying/nominal amount |
Allowance for ECL |
Gross carrying/ nominal amount |
Allowance for ECL |
Gross carrying/ nominal amount |
Allowance for ECL |
Gross carrying/ nominal amount |
Allowance for ECL |
Gross carrying/nominal amount |
Allowance for ECL |
| The bank |
£m |
£m |
£m |
£m |
£m |
£m |
£m |
£m |
£m |
£m |
| At 1 Jan 2022 |
65,710 |
(56) |
5,657 |
(58) |
1,088 |
(276) |
(1) |
- |
72,454 |
(390) |
| Transfers of financial instruments |
(959) |
(3) |
774 |
21 |
185 |
(18) |
- |
- |
- |
- |
| - transfers from stage 1 to stage 2 |
(6,499) |
6 |
6,499 |
(6) |
- |
- |
- |
- |
- |
- |
| - transfers from stage 2 to stage 1 |
5,554 |
(9) |
(5,554) |
9 |
- |
- |
- |
- |
- |
- |
| - transfers to stage 3 |
(53) |
- |
(172) |
18 |
225 |
(18) |
- |
- |
- |
- |
| - transfers from stage 3 |
39 |
- |
1 |
- |
(40) |
- |
- |
- |
- |
- |
| Net remeasurement of ECL arising from transfer of stage |
- |
6 |
- |
(11) |
- |
- |
- |
- |
- |
(5) |
| New financial assets originated or purchased |
11,825 |
(15) |
- |
- |
- |
- |
- |
- |
11,825 |
(15) |
| Asset derecognised (including final repayments) |
(6,459) |
1 |
(272) |
2 |
(21) |
2 |
- |
- |
(6,752) |
5 |
| Changes to risk parameters - further lending/repayments |
2,162 |
11 |
(79) |
14 |
(182) |
5 |
- |
- |
1,901 |
30 |
| Changes to risk parameters - credit quality |
- |
17 |
- |
(48) |
- |
(131) |
- |
- |
- |
(162) |
| Changes to model used for ECL calculation |
- |
7 |
- |
10 |
- |
- |
- |
- |
- |
17 |
| Assets written off |
- |
- |
- |
- |
(62) |
62 |
- |
- |
(62) |
62 |
| Credit related modifications that resulted in derecognition |
- |
- |
- |
- |
- |
- |
- |
- |
- |
- |
| Foreign exchange |
210 |
- |
19 |
(3) |
8 |
(2) |
1 |
- |
238 |
(5) |
| Others2 |
6,034 |
(1) |
- |
- |
- |
- |
- |
- |
6,034 |
(1) |
| At 31 Dec 2022 |
78,523 |
(33) |
6,099 |
(73) |
1,016 |
(358) |
- |
- |
85,638 |
(464) |
| ECL income statement change for the period |
|
27 |
|
(33) |
|
(124) |
|
- |
|
(130) |
| Recoveries |
|
|
|
|
|
|
|
|
|
- |
| Others |
|
|
|
|
|
|
|
|
|
18 |
| Total ECL income change for the period |
|
|
|
|
|
|
|
|
|
(112) |
| Reconciliation of changes in gross carrying/nominal amount and allowances for loans and advances to banks and customers including loan commitments and financial guarantees1 (continued) |
|||
|
|
At 31 Dec 2022 |
12 months ended 31 Dec 2022 |
|
|
|
Gross carrying/ |
Allowance for ECL |
ECL release/(charge) |
| |
£m |
£m |
£m |
| As above |
85,638 |
(464) |
(112) |
| Other financial assets measured at amortised cost |
169,321 |
(3) |
(1) |
| Non-trading reverse purchase agreement commitments |
3,316 |
- |
- |
| Performance and other guarantees not considered for IFRS 9 |
|
|
1 |
| Summary of financial instruments to which the impairment requirements in IFRS 9 are applied/Summary consolidated income statement |
258,275 |
(467) |
(112) |
| Debt instruments measured at FVOCI |
12,206 |
(4) |
2 |
| Total allowance for ECL/total income statement ECL change for the period |
n/a |
(471) |
(110) |
1 Excludes performance guarantee contracts to which the impairment requirements in IFRS 9 are not applied.
2 Includes the period on period movement in exposures relating to other HSBC Group companies. As at 31 December 2022, these amounted to £3bn and were classified as stage 1 with no ECL.
| Reconciliation of changes in gross carrying/nominal amount and allowances for loans and advances to banks and customers including loan commitments and financial guarantees1 (continued) |
||||||||||
| (Audited) |
||||||||||
|
|
Non-credit - impaired |
Credit - impaired |
|
|||||||
|
|
Stage 1 |
Stage 2 |
Stage 3 |
POCI |
Total |
|||||
|
|
Gross carrying/nominal amount |
Allowance for ECL |
Gross carrying/ nominal amount |
Allowance for ECL |
Gross carrying/ nominal amount |
Allowance for ECL |
Gross carrying/ nominal amount |
Allowance/ for ECL |
Gross carrying/nominal amount |
Allowance/ for ECL |
| The bank |
£m |
£m |
£m |
£m |
£m |
£m |
£m |
£m |
£m |
£m |
| 1 Jan 2021 |
78,422 |
(121) |
14,161 |
(213) |
1,395 |
(363) |
2 |
(2) |
93,980 |
(699) |
| Transfers of financial instruments: |
4,795 |
(27) |
(4,840) |
39 |
45 |
(12) |
- |
- |
- |
- |
| - transfers from stage 1 to stage 2 |
(2,261) |
3 |
2,261 |
(3) |
- |
- |
- |
- |
- |
- |
| - transfers from stage 2 to stage 1 |
7,043 |
(29) |
(7,043) |
29 |
- |
- |
- |
- |
- |
- |
| - transfers to stage 3 |
- |
- |
(59) |
13 |
59 |
(13) |
- |
- |
- |
- |
| - transfers from stage 3 |
13 |
(1) |
1 |
- |
(14) |
1 |
- |
- |
- |
- |
| Net remeasurement of ECL arising from transfer of stage |
- |
13 |
- |
(1) |
- |
(1) |
- |
- |
- |
11 |
| New financial assets originated or purchased |
11,532 |
(31) |
- |
- |
- |
- |
- |
- |
11,532 |
(31) |
| Asset derecognised (including final repayments) |
(11,861) |
2 |
(1,836) |
17 |
(80) |
4 |
(2) |
1 |
(13,779) |
24 |
| Changes to risk parameters - further lending/repayments |
(13,051) |
58 |
(1,813) |
32 |
(190) |
4 |
- |
- |
(15,054) |
94 |
| Changes to risk parameters - credit quality |
- |
48 |
- |
59 |
- |
13 |
- |
- |
- |
120 |
| Changes to model used for ECL calculation |
- |
2 |
- |
9 |
- |
- |
- |
- |
- |
11 |
| Assets written off |
- |
- |
- |
- |
(78) |
78 |
(1) |
1 |
(79) |
79 |
| Credit related modifications that resulted in derecognition |
- |
- |
- |
- |
- |
- |
- |
- |
- |
- |
| Foreign exchange |
(76) |
- |
(15) |
- |
(4) |
1 |
- |
- |
(95) |
1 |
| Others2 |
(4,051) |
- |
- |
- |
- |
- |
- |
- |
(4,051) |
- |
| At 31 Dec 2021 |
65,710 |
(56) |
5,657 |
(58) |
1,088 |
(276) |
(1) |
- |
72,454 |
(390) |
| ECL income statement change for the period |
|
92 |
|
116 |
|
20 |
|
1 |
|
229 |
| Recoveries |
|
|
|
|
|
|
|
|
|
1 |
| Others |
|
|
|
|
|
|
|
|
|
(23) |
| Total ECL income statement change for the period |
|
|
|
|
|
|
|
|
|
207 |
| Reconciliation of changes in gross carrying/nominal amount and allowances for loans and advances to banks and customers including loan commitments and financial guarantees1 (continued) |
|||
|
|
At 31 Dec 2021 |
12 months ended 31 Dec 2021 |
|
|
|
Gross carrying/nominal amount |
Allowance for ECL |
ECL release/(charge) |
| |
£m |
£m |
£m |
| As above |
72,454 |
(390) |
207 |
| Other financial assets measured at amortised cost |
135,033 |
(1) |
1 |
| Non-trading reverse purchase agreement commitments |
1,139 |
- |
- |
| Performance and other guarantees not considered for IFRS 9 |
|
|
4 |
| Summary of financial instruments to which the impairment requirements in IFRS 9 are applied/Summary consolidated income statement |
208,626 |
(391) |
212 |
| Debt instruments measured at FVOCI |
23,152 |
(4) |
5 |
| Total allowance for ECL/total income statement ECL change for the period |
n/a |
(395) |
217 |
1 Excludes performance guarantee contracts to which the impairment requirements in IFRS 9 are not applied.
2 Includes the period on period movement in exposures relating to other HSBC Group companies. As at 31 December 2021, these amounted to £(4)bn and were classified as stage 1 with no ECL.
Credit quality
Credit quality of financial instruments
(Audited)
We assess the credit quality of all financial instruments that are subject to credit risk. The credit quality of financial instruments is a point-in-time assessment of the probability of default ('PD'), whereas stages 1 and 2 are determined based on relative deterioration of credit quality since initial recognition.
Accordingly, for non-credit-impaired financial instruments, there is no direct relationship between the credit quality assessment and stages 1 and 2, though typically the lower credit quality bands exhibit a higher proportion in stage 2.
The five credit quality classifications provided below each encompass a range of granular internal credit rating grades assigned to wholesale and personal lending businesses and the external ratings attributed by external agencies to debt securities, as shown in the table on page 37.
| Distribution of financial instruments by credit quality at 31 December 2022 (continued) |
||||||||
| (Audited) |
||||||||
|
|
Gross carrying/notional amount |
Allowance for ECL |
Net |
|||||
|
|
Strong |
Good |
Satisfactory |
Sub- |
Credit impaired |
Total |
||
| The group |
£m |
£m |
£m |
£m |
£m |
£m |
£m |
£m |
| In-scope for IFRS 9 |
|
|
|
|
|
|
|
|
| Loans and advances to customers held at amortised cost |
27,997 |
19,618 |
19,612 |
4,263 |
2,227 |
73,717 |
(1,103) |
72,614 |
| - personal |
2,019 |
2,928 |
858 |
103 |
105 |
6,013 |
(55) |
5,958 |
| - corporate and commercial |
19,352 |
13,393 |
16,496 |
3,910 |
1,853 |
55,004 |
(937) |
54,067 |
| - non-bank financial institutions |
6,626 |
3,297 |
2,258 |
250 |
269 |
12,700 |
(111) |
12,589 |
| Loans and advances to banks held at amortised cost |
14,637 |
790 |
1,634 |
26 |
65 |
17,152 |
(43) |
17,109 |
| Cash and balances at central banks |
131,379 |
- |
55 |
- |
- |
131,434 |
(1) |
131,433 |
| Items in the course of collection from other banks |
2,281 |
- |
4 |
- |
- |
2,285 |
- |
2,285 |
| Reverse repurchase agreements - non-trading |
43,777 |
7,953 |
2,219 |
- |
- |
53,949 |
- |
53,949 |
| Financial investments |
3,028 |
- |
220 |
- |
- |
3,248 |
- |
3,248 |
| Assets held for sale |
19,419 |
1,598 |
1,773 |
124 |
291 |
23,205 |
(133) |
23,072 |
| Prepayments, accrued income and other assets |
53,972 |
708 |
896 |
26 |
32 |
55,634 |
(3) |
55,631 |
| - endorsements and acceptances |
208 |
4 |
25 |
- |
6 |
243 |
- |
243 |
| - accrued income and other |
53,764 |
704 |
871 |
26 |
26 |
55,391 |
(3) |
55,388 |
| Debt instruments measured at fair value through other comprehensive income1 |
28,248 |
2,471 |
626 |
105 |
- |
31,450 |
(24) |
31,426 |
| Out-of-scope for IFRS 9 |
|
|
|
|
|
|
|
|
| Trading assets |
26,961 |
4,323 |
9,966 |
298 |
- |
41,548 |
- |
41,548 |
| Other financial assets designated and otherwise mandatorily measured at fair value through profit or loss |
1,945 |
331 |
669 |
1 |
- |
2,946 |
- |
2,946 |
| Derivatives |
199,167 |
21,128 |
4,886 |
29 |
28 |
225,238 |
- |
225,238 |
| Assets held for sale |
107 |
- |
- |
- |
- |
107 |
- |
107 |
| Total gross carrying amount on balance sheet |
552,918 |
58,920 |
42,560 |
4,872 |
2,643 |
661,913 |
(1,307) |
660,606 |
|
|
|
|
|
|
|
|
|
|
| The group |
£m |
£m |
£m |
£m |
£m |
£m |
£m |
£m |
| Percentage of total credit quality |
84% |
9% |
6% |
1% |
-% |
100% |
|
|
| Loans and other credit-related commitments |
82,801 |
23,578 |
17,523 |
2,392 |
163 |
126,457 |
(67) |
126,390 |
| Loan and other credit related commitments for loans and advances to customers |
48,627 |
23,501 |
17,422 |
2,390 |
163 |
92,103 |
(66) |
92,037 |
| Loan and other credit-related commitments for loans and advances to banks |
34,174 |
77 |
101 |
2 |
- |
34,354 |
(1) |
34,353 |
| Financial guarantees |
2,924 |
1,171 |
995 |
153 |
84 |
5,327 |
(20) |
5,307 |
| In-scope: Irrevocable loan commitments and financial guarantees |
85,725 |
24,749 |
18,518 |
2,545 |
247 |
131,784 |
(87) |
131,697 |
| Loans and other credit-related commitments |
1,168 |
183 |
90 |
14 |
1 |
1,456 |
- |
1,456 |
| Performance and other guarantees |
9,791 |
3,583 |
3,074 |
599 |
89 |
17,136 |
(18) |
17,118 |
| Out-of-scope: Revocable loan commitments and non-financial guarantees |
10,959 |
3,766 |
3,164 |
613 |
90 |
18,592 |
(18) |
18,574 |
1 For the purposes of this disclosure gross carrying value is defined as the amortised cost of a financial asset, before adjusting for any loss allowance. As such the gross carrying value of debt instruments at FVOCI as presented above will not reconcile to the balance sheet as it excludes fair value gains and losses.
| Distribution of financial instruments by credit quality at 31 December 2021 (continued) |
||||||||
| (Audited) |
||||||||
|
|
Gross carrying/notional amount |
Allowance |
Net |
|||||
|
|
Strong |
Good |
Satisfactory |
Sub- standard |
Credit impaired |
Total |
||
| The group |
£m |
£m |
£m |
£m |
£m |
£m |
£m |
£m |
| In-scope for IFRS 9 |
|
|
|
|
|
|
|
|
| Loans and advances to customers held at amortised cost |
41,339 |
20,531 |
23,469 |
4,512 |
2,480 |
92,331 |
(1,154) |
91,177 |
| - personal |
18,956 |
4,136 |
1,793 |
56 |
453 |
25,394 |
(163) |
25,231 |
| - corporate and commercial |
16,533 |
13,867 |
19,597 |
4,305 |
1,785 |
56,087 |
(964) |
55,123 |
| - non-bank financial institutions |
5,850 |
2,528 |
2,079 |
151 |
242 |
10,850 |
(27) |
10,823 |
| Loans and advances to banks held at amortised cost |
8,649 |
320 |
1,815 |
5 |
- |
10,789 |
(5) |
10,784 |
| Cash and balances at central banks |
108,133 |
198 |
151 |
- |
- |
108,482 |
- |
108,482 |
| Items in the course of collection from other banks |
343 |
- |
3 |
- |
- |
346 |
- |
346 |
| Reverse repurchase agreements - non-trading |
47,071 |
6,355 |
1,022 |
- |
- |
54,448 |
- |
54,448 |
| Financial investments |
2 |
- |
8 |
- |
- |
10 |
- |
10 |
| Assets held for sale |
- |
- |
- |
- |
- |
- |
- |
- |
| Prepayments, accrued income and other assets |
36,558 |
666 |
1,574 |
11 |
42 |
38,851 |
(9) |
38,842 |
| - endorsements and acceptances |
105 |
61 |
23 |
- |
7 |
196 |
- |
196 |
| - accrued income and other |
36,453 |
605 |
1,551 |
11 |
35 |
38,655 |
(9) |
38,646 |
| Debt instruments measured at fair value through other comprehensive income1 |
36,410 |
1,899 |
1,406 |
118 |
- |
39,833 |
(19) |
39,814 |
| Out-of-scope for IFRS 9 |
|
|
|
|
|
|
|
|
| Trading assets |
28,110 |
5,331 |
8,985 |
350 |
- |
42,776 |
- |
42,776 |
| Other financial assets designated and otherwise mandatorily measured at fair value through profit or loss |
2,246 |
304 |
2,644 |
3 |
- |
5,197 |
- |
5,197 |
| Derivatives |
111,471 |
25,487 |
4,054 |
207 |
2 |
141,221 |
- |
141,221 |
| Assets held for sale |
|
|
|
|
|
|
|
|
| Total gross carrying amount on balance sheet |
420,332 |
61,091 |
45,131 |
5,206 |
2,524 |
534,284 |
(1,187) |
533,097 |
| Percentage of total credit quality |
78.7% |
11.4% |
8.4% |
1.0% |
0.5% |
100.0% |
|
|
| Loans and other credit-related commitments |
71,741 |
21,860 |
20,018 |
1,874 |
202 |
115,695 |
(55) |
115,640 |
| Financial guarantees |
8,412 |
1,088 |
1,245 |
210 |
99 |
11,054 |
(17) |
11,037 |
| In-scope: Irrevocable loan commitments and financial guarantees |
80,153 |
22,948 |
21,263 |
2,084 |
301 |
126,749 |
(72) |
126,677 |
| Loans and other credit-related commitments |
2,134 |
1,114 |
432 |
94 |
7 |
3,781 |
- |
3,781 |
| Performance and other guarantees |
7,738 |
4,359 |
3,130 |
490 |
116 |
15,833 |
(31) |
15,802 |
| Out-of-scope: Revocable loan commitments and non-financial guarantees |
9,872 |
5,473 |
3,562 |
584 |
123 |
19,614 |
(31) |
19,583 |
1 For the purposes of this disclosure gross carrying value is defined as the amortised cost of a financial asset, before adjusting for any loss allowance. As such the gross carrying value of debt instruments at FVOCI as presented above will not reconcile to the balance sheet as it excludes fair value gains and losses.
| Distribution of financial instruments by credit quality at 31 December 2022 |
||||||||
| (Audited) |
||||||||
|
|
Gross carrying/notional amount |
Allowance for ECL |
Net |
|||||
|
|
Strong |
Good |
Satisfactory |
Sub- |
Credit impaired |
Total |
||
| The bank |
£m |
£m |
£m |
£m |
£m |
£m |
£m |
£m |
| In-scope for IFRS 9 |
|
|
|
|
|
|
|
|
| Loans and advances to customers held at amortised cost |
21,601 |
9,291 |
4,838 |
765 |
875 |
37,370 |
(378) |
36,992 |
| - personal |
1,837 |
927 |
797 |
10 |
13 |
3,584 |
(12) |
3,572 |
| - corporate and commercial |
12,018 |
6,001 |
3,230 |
613 |
594 |
22,456 |
(247) |
22,209 |
| - non-bank financial institutions |
7,746 |
2,363 |
811 |
142 |
268 |
11,330 |
(119) |
11,211 |
| Loans and advances to banks held at amortised cost |
13,764 |
512 |
163 |
25 |
65 |
14,529 |
(43) |
14,486 |
| Cash and balances at central banks |
78,442 |
- |
- |
- |
- |
78,442 |
(1) |
78,441 |
| Items in the course of collection from other banks |
1,863 |
- |
- |
- |
- |
1,863 |
- |
1,863 |
| Reverse repurchase agreements - non-trading |
33,159 |
7,763 |
2,133 |
- |
- |
43,055 |
- |
43,055 |
| Financial investments |
6,190 |
- |
188 |
- |
- |
6,378 |
- |
6,378 |
| Prepayments, accrued income and other assets |
39,376 |
95 |
81 |
10 |
21 |
39,583 |
(2) |
39,581 |
| - endorsements and acceptances |
205 |
4 |
3 |
- |
6 |
218 |
- |
218 |
| - accrued income and other |
39,171 |
91 |
78 |
10 |
15 |
39,365 |
(2) |
39,363 |
| Debt instruments measured at fair value through other comprehensive income1 |
12,827 |
64 |
307 |
- |
- |
13,198 |
(4) |
13,194 |
| Out-of-scope for IFRS 9 |
|
|
|
|
|
|
|
|
| Trading assets |
18,479 |
4,226 |
9,213 |
298 |
- |
32,216 |
- |
32,216 |
| Other financial assets designated and otherwise mandatorily measured at fair value through profit or loss |
149 |
214 |
651 |
1 |
- |
1,015 |
- |
1,015 |
| Derivatives |
174,548 |
18,118 |
4,031 |
17 |
- |
196,714 |
- |
196,714 |
| Total gross carrying amount on balance sheet |
400,398 |
40,283 |
21,605 |
1,116 |
961 |
464,363 |
(428) |
463,935 |
| Percentage of total credit quality |
86.2% |
8.7% |
4.7% |
0.2% |
0.2% |
100.0% |
|
|
| Loans and other credit-related commitments |
25,143 |
6,577 |
3,200 |
732 |
40 |
35,692 |
(31) |
35,661 |
| Financial guarantees |
729 |
205 |
388 |
5 |
36 |
1,363 |
(12) |
1,351 |
| In-scope: Irrevocable loan commitments and financial guarantees |
25,872 |
6,782 |
3,588 |
737 |
76 |
37,055 |
(43) |
37,012 |
| Loans and other credit-related commitments |
493 |
183 |
91 |
14 |
1 |
782 |
- |
782 |
| Performance and other guarantees |
5,338 |
1,083 |
417 |
42 |
6 |
6,886 |
(7) |
6,879 |
| Out-of-scope: Revocable loan commitments and non-financial guarantees |
5,831 |
1,266 |
508 |
56 |
7 |
7,668 |
(7) |
7,661 |
1 For the purposes of this disclosure gross carrying value is defined as the amortised cost of a financial asset, before adjusting for any loss allowance. As such the gross carrying value of debt instruments at FVOCI as presented above will not reconcile to the balance sheet as it excludes fair value gains and losses.
| Distribution of financial instruments by credit quality at 31 December 2021 (continued) |
||||||||
| (Audited) |
||||||||
|
|
Gross carrying/notional amount |
Allowance |
Net |
|||||
|
|
Strong |
Good |
Satisfactory |
Sub-standard |
Credit impaired |
Total |
||
| The bank |
£m |
£m |
£m |
£m |
£m |
£m |
£m |
£m |
| In-scope for IFRS 9 |
|
|
|
|
|
|
|
|
| Loans and advances to customers held at amortised cost |
16,993 |
9,038 |
6,467 |
804 |
984 |
34,286 |
(350) |
33,936 |
| - personal |
1,909 |
850 |
860 |
13 |
48 |
3,680 |
(6) |
3,674 |
| - corporate and commercial |
8,120 |
6,649 |
5,003 |
729 |
681 |
21,182 |
(308) |
20,874 |
| - non-bank financial institutions |
6,964 |
1,539 |
604 |
62 |
255 |
9,424 |
(36) |
9,388 |
| Loans and advances to banks held at amortised cost |
6,427 |
166 |
187 |
2 |
- |
6,782 |
(4) |
6,778 |
| Cash and balances at central banks |
63,008 |
- |
- |
- |
- |
63,008 |
- |
63,008 |
| Items in the course of collection from other banks |
211 |
- |
- |
- |
- |
211 |
- |
211 |
| Reverse repurchase agreements - non-trading |
32,877 |
5,916 |
915 |
- |
- |
39,708 |
- |
39,708 |
| Financial investments |
3,337 |
- |
- |
- |
- |
3,337 |
- |
3,337 |
| Prepayments, accrued income and other assets |
28,524 |
121 |
94 |
2 |
28 |
28,769 |
(1) |
28,768 |
| - endorsements and acceptances |
90 |
61 |
13 |
- |
7 |
171 |
- |
171 |
| - accrued income and other |
28,434 |
60 |
81 |
2 |
21 |
28,598 |
(1) |
28,597 |
| Debt instruments measured at fair value through other comprehensive income1 |
21,748 |
64 |
1,039 |
- |
- |
22,851 |
(4) |
22,847 |
| Out-of-scope for IFRS 9 |
|
|
|
|
|
|
|
|
| Trading assets |
18,318 |
5,082 |
8,470 |
350 |
- |
32,220 |
- |
32,220 |
| Other financial assets designated and otherwise mandatorily measured at fair value through profit or loss |
138 |
- |
2,504 |
2 |
- |
2,644 |
- |
2,644 |
| Derivatives |
98,698 |
24,160 |
2,854 |
75 |
- |
125,787 |
- |
125,787 |
| Total gross carrying amount on balance sheet |
290,279 |
44,547 |
22,530 |
1,235 |
1,012 |
359,603 |
(359) |
359,244 |
| Percentage of total credit quality |
80.7% |
12.4% |
6.3% |
0.3% |
0.3% |
100.0% |
|
|
| Loans and other credit-related commitments |
20,446 |
6,663 |
3,651 |
452 |
43 |
31,255 |
(29) |
31,226 |
| Financial guarantees |
630 |
89 |
471 |
20 |
60 |
1,270 |
(7) |
1,263 |
| In-scope: Irrevocable loan commitments and financial guarantees |
21,076 |
6,752 |
4,122 |
472 |
103 |
32,525 |
(36) |
32,489 |
| Loans and other credit-related commitments |
620 |
383 |
126 |
86 |
1 |
1,216 |
- |
1,216 |
| Performance and other guarantees |
4,846 |
1,939 |
480 |
56 |
13 |
7,334 |
(7) |
7,327 |
| Out-of-scope: Revocable loan commitments and non-financial guarantees |
5,466 |
2,322 |
606 |
142 |
14 |
8,550 |
(7) |
8,543 |
1 For the purposes of this disclosure gross carrying value is defined as the amortised cost of a financial asset, before adjusting for any loss allowance. As such the gross carrying value of debt instruments at FVOCI as presented above will not reconcile to the balance sheet as it excludes fair value gains and losses.
| Distribution of financial instruments to which the impairment requirements in IFRS 9 are applied, by credit quality and stage distribution |
||||||||
| (Audited) |
||||||||
|
|
Gross carrying/notional amount |
Allowance for ECL |
Net |
|||||
|
|
Strong |
Good |
Satisfactory |
Sub- standard |
Credit impaired |
Total |
||
| The group |
£m |
£m |
£m |
£m |
£m |
£m |
£m |
£m |
| Loans and advances to customers at amortised cost |
27,997 |
19,618 |
19,612 |
4,263 |
2,227 |
73,717 |
(1,103) |
72,614 |
| - stage 1 |
27,183 |
18,885 |
16,313 |
1,292 |
- |
63,673 |
(51) |
63,622 |
| - stage 2 |
814 |
733 |
3,299 |
2,971 |
- |
7,817 |
(145) |
7,672 |
| - stage 3 |
- |
- |
- |
- |
2,224 |
2,224 |
(907) |
1,317 |
| - POCI |
- |
- |
- |
- |
3 |
3 |
- |
3 |
| Loans and advances to banks at amortised cost |
14,637 |
790 |
1,634 |
26 |
65 |
17,152 |
(43) |
17,109 |
| - stage 1 |
14,502 |
565 |
1,605 |
1 |
- |
16,673 |
(6) |
16,667 |
| - stage 2 |
135 |
225 |
29 |
25 |
- |
414 |
(21) |
393 |
| - stage 3 |
- |
- |
- |
- |
65 |
65 |
(16) |
49 |
| - POCI |
- |
- |
- |
- |
- |
- |
- |
- |
| Other financial assets measured at amortised cost |
253,856 |
10,259 |
5,167 |
150 |
323 |
269,755 |
(137) |
269,618 |
| - stage 1 |
253,577 |
9,893 |
4,272 |
28 |
- |
267,770 |
(14) |
267,756 |
| - stage 2 |
279 |
366 |
895 |
122 |
- |
1,662 |
(17) |
1,645 |
| - stage 3 |
- |
- |
- |
- |
323 |
323 |
(106) |
217 |
| - POCI |
- |
- |
- |
- |
- |
- |
- |
- |
| Loans and other credit-related commitments |
82,801 |
23,578 |
17,523 |
2,392 |
163 |
126,457 |
(67) |
126,390 |
| - stage 1 |
79,931 |
21,530 |
14,570 |
963 |
- |
116,994 |
(13) |
116,981 |
| - stage 2 |
2,870 |
2,048 |
2,953 |
1,429 |
- |
9,300 |
(32) |
9,268 |
| - stage 3 |
- |
- |
- |
- |
163 |
163 |
(22) |
141 |
| - POCI |
- |
- |
- |
- |
- |
- |
- |
- |
| Financial guarantees |
2,924 |
1,171 |
995 |
153 |
84 |
5,327 |
(20) |
5,307 |
| - stage 1 |
2,895 |
1,058 |
727 |
35 |
- |
4,715 |
(1) |
4,714 |
| - stage 2 |
29 |
113 |
268 |
118 |
- |
528 |
(2) |
526 |
| - stage 3 |
- |
- |
- |
- |
84 |
84 |
(17) |
67 |
| - POCI |
- |
- |
- |
- |
- |
- |
- |
- |
| At 31 Dec 2022 |
382,215 |
55,416 |
44,931 |
6,984 |
2,862 |
492,408 |
(1,370) |
491,038 |
| Debt instruments at FVOCI1 |
|
|
|
|
|
|
|
|
| - stage 1 |
28,047 |
2,384 |
547 |
- |
- |
30,978 |
(10) |
30,968 |
| - stage 2 |
201 |
87 |
79 |
105 |
- |
472 |
(14) |
458 |
| - stage 3 |
- |
- |
- |
- |
- |
- |
- |
- |
| - POCI |
- |
- |
- |
- |
- |
- |
- |
- |
| At 31 Dec 2022 |
28,248 |
2,471 |
626 |
105 |
- |
31,450 |
(24) |
31,426 |
1 For the purposes of this disclosure gross carrying value is defined as the amortised cost of a financial asset, before adjusting for any loss allowance. As such the gross carrying value of debt instruments at FVOCI as presented above will not reconcile to the balance sheet as it excludes fair value gains and losses.
| Distribution of financial instruments to which the impairment requirements in IFRS 9 are applied, by credit quality and stage distribution (continued) |
||||||||
| (Audited) |
||||||||
|
|
Gross carrying/notional amount |
Allowance for ECL |
Net |
|||||
|
|
Strong |
Good |
Satisfactory |
Sub- standard |
Credit impaired |
Total |
||
| The group |
£m |
£m |
£m |
£m |
£m |
£m |
£m |
£m |
| Loans and advances to customers at amortised cost |
41,339 |
20,531 |
23,469 |
4,512 |
2,480 |
92,331 |
(1,154) |
91,177 |
| - stage 1 |
40,831 |
19,376 |
19,077 |
1,446 |
- |
80,730 |
(86) |
80,644 |
| - stage 2 |
508 |
1,155 |
4,392 |
3,066 |
- |
9,121 |
(158) |
8,963 |
| - stage 3 |
- |
- |
- |
- |
2,478 |
2,478 |
(908) |
1,570 |
| - POCI |
- |
- |
- |
- |
2 |
2 |
(2) |
- |
| Loans and advances to banks at amortised cost |
8,649 |
320 |
1,815 |
5 |
- |
10,789 |
(5) |
10,784 |
| - stage 1 |
8,620 |
311 |
1,814 |
5 |
- |
10,750 |
(4) |
10,746 |
| - stage 2 |
29 |
9 |
1 |
- |
- |
39 |
(1) |
38 |
| - stage 3 |
- |
- |
- |
- |
- |
- |
- |
- |
| - POCI |
- |
- |
- |
- |
- |
- |
- |
- |
| Other financial assets measured at amortised cost |
192,107 |
7,219 |
2,758 |
11 |
42 |
202,137 |
(9) |
202,128 |
| - stage 1 |
192,105 |
7,214 |
2,727 |
2 |
- |
202,048 |
- |
202,048 |
| - stage 2 |
2 |
5 |
31 |
9 |
- |
47 |
- |
47 |
| - stage 3 |
- |
- |
- |
- |
42 |
42 |
(9) |
33 |
| - POCI |
- |
- |
- |
- |
- |
- |
- |
- |
| Loans and other credit-related commitments |
71,741 |
21,860 |
20,018 |
1,874 |
202 |
115,695 |
(55) |
115,640 |
| - stage 1 |
71,074 |
19,960 |
16,337 |
551 |
- |
107,922 |
(25) |
107,897 |
| - stage 2 |
667 |
1,900 |
3,681 |
1,323 |
- |
7,571 |
(22) |
7,549 |
| - stage 3 |
- |
- |
- |
- |
202 |
202 |
(8) |
194 |
| - POCI |
- |
- |
- |
- |
- |
- |
- |
- |
| Financial guarantees |
8,412 |
1,088 |
1,245 |
210 |
99 |
11,054 |
(17) |
11,037 |
| - stage 1 |
8,340 |
951 |
849 |
75 |
- |
10,215 |
(3) |
10,212 |
| - stage 2 |
72 |
137 |
396 |
135 |
- |
740 |
(7) |
733 |
| - stage 3 |
- |
- |
- |
- |
99 |
99 |
(7) |
92 |
| - POCI |
- |
- |
- |
- |
- |
- |
- |
- |
| At 31 Dec 2021 |
322,248 |
51,018 |
49,305 |
6,612 |
2,823 |
432,006 |
(1,240) |
430,766 |
| Debt instruments at FVOCI1 |
|
|
|
|
|
|
|
|
| - stage 1 |
36,005 |
1,825 |
1,292 |
- |
- |
39,122 |
(10) |
39,112 |
| - stage 2 |
405 |
74 |
114 |
118 |
- |
711 |
(9) |
702 |
| - stage 3 |
- |
- |
- |
- |
- |
- |
- |
- |
| - POCI |
- |
- |
- |
- |
- |
- |
- |
- |
| At 31 Dec 2021 |
36,410 |
1,899 |
1,406 |
118 |
- |
39,833 |
(19) |
39,814 |
1 For the purposes of this disclosure gross carrying value is defined as the amortised cost of a financial asset, before adjusting for any loss allowance. As such the gross carrying value of debt instruments at FVOCI as presented above will not reconcile to the balance sheet as it excludes fair value gains and losses.
| Distribution of financial instruments to which the impairment requirements in IFRS 9 are applied, by credit quality and stage distribution (continued) |
||||||||
| (Audited) |
||||||||
|
|
Gross carrying/notional amount |
Allowance for ECL |
Net |
|||||
|
|
Strong |
Good |
Satisfactory |
Sub- standard |
Credit impaired |
Total |
||
| The bank |
£m |
£m |
£m |
£m |
£m |
£m |
£m |
£m |
| Loans and advances to customers at amortised cost |
21,601 |
9,291 |
4,838 |
765 |
875 |
37,370 |
(378) |
36,992 |
| - stage 1 |
20,937 |
9,032 |
3,849 |
101 |
- |
33,919 |
(19) |
33,900 |
| - stage 2 |
664 |
259 |
989 |
664 |
- |
2,576 |
(35) |
2,541 |
| - stage 3 |
- |
- |
- |
- |
875 |
875 |
(324) |
551 |
| - POCI |
- |
- |
- |
- |
- |
- |
- |
- |
| Loans and advances to banks at amortised cost |
13,764 |
512 |
163 |
25 |
65 |
14,529 |
(43) |
14,486 |
| - stage 1 |
13,663 |
502 |
134 |
- |
- |
14,299 |
(5) |
14,294 |
| - stage 2 |
101 |
10 |
29 |
25 |
- |
165 |
(22) |
143 |
| - stage 3 |
- |
- |
- |
- |
65 |
65 |
(16) |
49 |
| - POCI |
- |
- |
- |
- |
- |
- |
- |
- |
| Other financial assets measured at amortised cost |
159,030 |
7,858 |
2,402 |
10 |
21 |
169,321 |
(3) |
169,318 |
| - stage 1 |
159,026 |
7,857 |
2,393 |
- |
- |
169,276 |
(2) |
169,274 |
| - stage 2 |
4 |
1 |
9 |
10 |
- |
24 |
(1) |
23 |
| - stage 3 |
- |
- |
- |
- |
21 |
21 |
- |
21 |
| - POCI |
- |
- |
- |
- |
- |
- |
- |
- |
| Loans and other credit-related commitments |
25,143 |
6,577 |
3,200 |
732 |
40 |
35,692 |
(31) |
35,661 |
| - stage 1 |
24,007 |
5,971 |
2,329 |
120 |
- |
32,427 |
(9) |
32,418 |
| - stage 2 |
1,136 |
606 |
871 |
612 |
- |
3,225 |
(15) |
3,210 |
| - stage 3 |
- |
- |
- |
- |
40 |
40 |
(7) |
33 |
| - POCI |
- |
- |
- |
- |
- |
- |
- |
- |
| Financial guarantees |
729 |
205 |
388 |
5 |
36 |
1,363 |
(12) |
1,351 |
| - stage 1 |
729 |
200 |
265 |
- |
- |
1,194 |
- |
1,194 |
| - stage 2 |
- |
5 |
123 |
5 |
- |
133 |
(1) |
132 |
| - stage 3 |
- |
- |
- |
- |
36 |
36 |
(11) |
25 |
| - POCI |
- |
- |
- |
- |
- |
- |
- |
- |
| At 31 Dec 2022 |
220,267 |
24,443 |
10,991 |
1,537 |
1,037 |
258,275 |
(467) |
257,808 |
| Debt instruments at FVOCI1 |
|
|
|
|
|
|
|
|
| - stage 1 |
12,827 |
64 |
302 |
- |
- |
13,193 |
(1) |
13,192 |
| - stage 2 |
- |
- |
5 |
- |
- |
5 |
(3) |
2 |
| - stage 3 |
- |
- |
- |
- |
- |
- |
- |
- |
| - POCI |
- |
- |
- |
- |
- |
- |
- |
- |
| At 31 Dec 2022 |
12,827 |
64 |
307 |
- |
- |
13,198 |
(4) |
13,194 |
1 For the purposes of this disclosure gross carrying value is defined as the amortised cost of a financial asset, before adjusting for any loss allowance. As such the gross carrying value of debt instruments at FVOCI as presented above will not reconcile to the balance sheet as it excludes fair value gains and losses.
| Distribution of financial instruments to which the impairment requirements in IFRS 9 are applied, by credit quality and stage distribution (continued) |
||||||||
| (Audited) |
||||||||
|
|
Gross carrying/notional amount |
Allowance for ECL |
Net |
|||||
|
|
Strong |
Good |
Satisfactory |
Sub- standard |
Credit impaired |
Total |
||
| The bank |
£m |
£m |
£m |
£m |
£m |
£m |
£m |
£m |
| Loans and advances to customers at amortised cost |
16,993 |
9,038 |
6,467 |
804 |
984 |
34,286 |
(350) |
33,936 |
| - stage 1 |
16,757 |
8,305 |
4,964 |
79 |
- |
30,105 |
(33) |
30,072 |
| - stage 2 |
236 |
733 |
1,503 |
725 |
- |
3,197 |
(47) |
3,150 |
| - stage 3 |
- |
- |
- |
- |
984 |
984 |
(270) |
714 |
| - POCI |
- |
- |
- |
- |
- |
- |
- |
- |
| Loans and advances to banks at amortised cost |
6,427 |
166 |
187 |
2 |
- |
6,782 |
(4) |
6,778 |
| - stage 1 |
6,427 |
160 |
186 |
2 |
- |
6,775 |
(3) |
6,772 |
| - stage 2 |
- |
6 |
1 |
- |
- |
7 |
(1) |
6 |
| - stage 3 |
- |
- |
- |
- |
- |
- |
- |
- |
| - POCI |
- |
- |
- |
- |
- |
- |
- |
- |
| Other financial assets measured at amortised cost |
127,957 |
6,037 |
1,009 |
2 |
28 |
135,033 |
(1) |
135,032 |
| - stage 1 |
127,956 |
6,037 |
991 |
- |
- |
134,984 |
- |
134,984 |
| - stage 2 |
1 |
- |
18 |
2 |
- |
21 |
- |
21 |
| - stage 3 |
- |
- |
- |
- |
28 |
28 |
(1) |
27 |
| - POCI |
- |
- |
- |
- |
- |
- |
- |
- |
| Loans and other credit-related commitments |
20,446 |
6,663 |
3,651 |
452 |
43 |
31,255 |
(29) |
31,226 |
| - stage 1 |
20,307 |
6,469 |
2,135 |
- |
- |
28,911 |
(15) |
28,896 |
| - stage 2 |
139 |
194 |
1,516 |
452 |
- |
2,301 |
(11) |
2,290 |
| - stage 3 |
- |
- |
- |
- |
43 |
43 |
(3) |
40 |
| - POCI |
- |
- |
- |
- |
- |
- |
- |
- |
| Financial guarantees |
630 |
89 |
471 |
20 |
60 |
1,270 |
(7) |
1,263 |
| - stage 1 |
630 |
89 |
324 |
17 |
- |
1,060 |
(1) |
1,059 |
| - stage 2 |
- |
- |
147 |
3 |
- |
150 |
- |
150 |
| - stage 3 |
- |
- |
- |
- |
60 |
60 |
(6) |
54 |
| - POCI |
- |
- |
- |
- |
- |
- |
- |
- |
| At 31 Dec 2021 |
172,453 |
21,993 |
11,785 |
1,280 |
1,115 |
208,626 |
(391) |
208,235 |
| Debt instruments at FVOCI1 |
|
|
|
|
|
|
|
|
| - stage 1 |
21,748 |
64 |
1,035 |
- |
- |
22,847 |
(2) |
22,845 |
| - stage 2 |
- |
- |
4 |
- |
- |
4 |
(2) |
2 |
| - stage 3 |
- |
- |
- |
- |
- |
- |
- |
- |
| - POCI |
- |
- |
- |
- |
- |
- |
- |
- |
| At 31 Dec 2021 |
21,748 |
64 |
1,039 |
- |
- |
22,851 |
(4) |
22,847 |
1 For the purposes of this disclosure gross carrying value is defined as the amortised cost of a financial asset, before adjusting for any loss allowance. As such the gross carrying value of debt instruments at FVOCI as presented above will not reconcile to the balance sheet as it excludes fair value gains and losses.
Credit‑impaired loans
(Audited)
The group determines that a financial instrument is credit impaired and in stage 3 by considering relevant objective evidence, primarily whether:
• contractual payments of either principal or interest are past due for more than 90 days;
• there are other indications that the borrower is unlikely to pay such as that a concession has been granted to the borrower for economic or legal reasons relating to the borrower's financial condition; and
•
the loan is otherwise considered to be in default. If such unlikeliness to pay is not identified at an earlier stage, it is deemed to occur when an exposure is 90 days past due, even where regulatory rules permit default to be defined based on 180 days past due. Therefore, the definitions of credit-impaired and default are aligned as far as possible so that stage 3 represents all loans which are considered defaulted or otherwise credit-impaired.
Forbearance
The following table shows the gross carrying amounts of the group's holdings of forborne loans and advances to customers by industry sector and by stages.
A summary of our current policies and practices for forbearance is set out in 'Credit risk management' on page 37.
| Forborne loans and advances to customers at amortised costs by stage allocation |
|||||
|
|
Stage 1 |
Stage 2 |
Stage 3 |
POCI |
Total |
| The group |
£m |
£m |
£m |
£m |
£m |
| Gross carrying amount |
|
|
|
|
|
| Personal |
- |
29 |
32 |
- |
61 |
| - first lien residential mortgages |
- |
24 |
27 |
- |
51 |
| - other personal lending which is secured |
- |
3 |
4 |
- |
7 |
| - credit cards |
- |
1 |
- |
- |
1 |
| - other personal lending which is unsecured |
- |
1 |
1 |
- |
2 |
| Wholesale |
- |
1,816 |
726 |
- |
2,542 |
| - corporate and commercial |
- |
1,804 |
722 |
- |
2,526 |
| - non-bank financial institutions |
- |
12 |
4 |
- |
16 |
| At 31 Dec 2022 |
- |
1,845 |
758 |
- |
2,603 |
| Allowance for ECL |
|
|
|
|
|
| Personal |
- |
(2) |
(4) |
- |
(6) |
| - first lien residential mortgages |
- |
(2) |
(4) |
- |
(6) |
| - other personal lending which is secured |
- |
- |
- |
- |
- |
| - credit cards |
- |
- |
- |
- |
- |
| - other personal lending which is unsecured |
- |
- |
- |
- |
- |
| Wholesale |
- |
(25) |
(252) |
- |
(277) |
| - corporate and commercial |
- |
(24) |
(252) |
- |
(276) |
| - non-bank financial institutions |
- |
(1) |
- |
- |
(1) |
| At 31 Dec 2022 |
- |
(27) |
(256) |
- |
(283) |
| The group |
|
|
|
|
|
| Gross carrying amount |
|
|
|
|
|
| Personal |
- |
- |
132 |
- |
132 |
| - first lien residential mortgages |
- |
- |
96 |
- |
96 |
| - other personal lending |
- |
- |
36 |
- |
36 |
| Wholesale |
49 |
192 |
706 |
2 |
949 |
| - corporate and commercial |
49 |
192 |
702 |
2 |
945 |
| - non-bank financial institutions |
- |
- |
4 |
- |
4 |
| At 31 Dec 20211 |
49 |
192 |
838 |
2 |
1,081 |
| Allowance for ECL |
|
|
|
|
|
| Personal |
- |
- |
(15) |
- |
(15) |
| - first lien residential mortgages |
- |
- |
(11) |
- |
(11) |
| - other personal lending |
- |
- |
(4) |
- |
(4) |
| Wholesale |
(1) |
(5) |
(218) |
(2) |
(226) |
| - corporate and commercial |
(1) |
(5) |
(218) |
(2) |
(226) |
| - non-bank financial institutions |
- |
- |
- |
- |
- |
| At 31 Dec 20211 |
(1) |
(5) |
(233) |
(2) |
(241) |
1 Forborne exposures and allowances for ECL at 31 December 2021 have not been restated and agreed with the policies and disclosures presented in the Annual Report and Accounts 2021.
Following the adoption of the EBA 'Guidelines on the application of definition of default', retail and wholesale loans are identified as forborne and classified as either performing or non-performing when we modify the contractual terms due to financial difficulty of the borrower. At 31 December 2022, we reported £1,845m (31 December 2021: £241m) of performing forborne loans. The increase of £1,604m was mainly driven by the inclusion of non-payment-related concessions in the forbearance assessment since 1 January 2022.
| Forborne loans and advances to customers at amortised costs by stage allocation (continued) |
|||||
|
|
Stage 1 |
Stage 2 |
Stage 3 |
POCI |
Total |
| The bank |
£m |
£m |
£m |
£m |
£m |
| Gross carrying amount |
|
|
|
|
|
| Personal |
- |
1 |
7 |
- |
8 |
| - first lien residential mortgages |
- |
- |
6 |
- |
6 |
| - credit cards |
- |
1 |
- |
- |
1 |
| - other personal lending which is unsecured |
- |
- |
1 |
- |
1 |
| Wholesale |
- |
106 |
364 |
- |
470 |
| - corporate and commercial |
- |
106 |
364 |
- |
470 |
| At 31 Dec 2022 |
- |
107 |
371 |
- |
478 |
| Allowance for ECL |
|
|
|
|
|
| Personal |
- |
- |
(1) |
- |
(1) |
| - first lien residential mortgages |
- |
- |
(1) |
- |
(1) |
| - credit cards |
- |
- |
- |
- |
- |
| - other personal lending which is unsecured |
- |
- |
- |
- |
- |
| Wholesale |
- |
(1) |
(158) |
- |
(159) |
| - corporate and commercial |
- |
(1) |
(158) |
- |
(159) |
| At 31 Dec 2022 |
- |
(1) |
(159) |
- |
(160) |
| The bank |
|
|
|
|
|
| Gross carrying amount |
|
|
|
|
|
| Personal |
- |
- |
3 |
- |
3 |
| - first lien residential mortgages |
- |
- |
2 |
- |
2 |
| - other personal lending |
- |
- |
1 |
- |
1 |
| Wholesale |
40 |
158 |
431 |
- |
629 |
| - corporate and commercial |
40 |
158 |
431 |
- |
629 |
| At 31 Dec 20211 |
40 |
158 |
434 |
- |
632 |
| Allowance for ECL |
|
|
|
|
|
| Personal |
- |
- |
- |
- |
- |
| - first lien residential mortgages |
- |
- |
- |
- |
- |
| - other personal lending |
- |
- |
- |
- |
- |
| Wholesale |
(1) |
(2) |
(124) |
- |
(127) |
| - corporate and commercial |
(1) |
(2) |
(124) |
- |
(127) |
| At 31 Dec 20211 |
(1) |
(2) |
(124) |
- |
(127) |
1 Forborne exposures and allowances for ECL at 31 December 2021 have not been restated and agreed with the policies and disclosures presented in the Annual Report and Accounts 2021.
Wholesale lending
This section provides further details on the countries and industries comprising wholesale loans and advances to customers and banks. Industry granularity is also provided by stage with geographical data presented for loans and advances to customers and banks, loans and other credit-related commitments and financial guarantees.
| Total wholesale lending for loans and advances to banks and customers by stage distribution |
||||||||||
|
|
Gross carrying amount |
Allowance for ECL |
||||||||
|
|
Stage 1 |
Stage 2 |
Stage 3 |
POCI |
Total |
Stage 1 |
Stage 2 |
Stage 3 |
POCI |
Total |
| The group |
£m |
£m |
£m |
£m |
£m |
£m |
£m |
£m |
£m |
£m |
| Corporate and commercial |
46,671 |
6,479 |
1,851 |
3 |
55,004 |
(40) |
(123) |
(774) |
- |
(937) |
| - agriculture, forestry and fishing |
166 |
20 |
29 |
- |
215 |
- |
(1) |
(12) |
- |
(13) |
| - mining and quarrying |
943 |
1 |
- |
- |
944 |
(2) |
- |
- |
- |
(2) |
| - manufacture |
9,963 |
1,228 |
317 |
2 |
11,510 |
(7) |
(13) |
(78) |
- |
(98) |
| - electricity, gas, steam and air-conditioning supply |
1,838 |
165 |
78 |
- |
2,081 |
(1) |
(1) |
(6) |
- |
(8) |
| - water supply, sewerage, waste management and remediation |
208 |
6 |
5 |
- |
219 |
- |
- |
(4) |
- |
(4) |
| - construction |
571 |
107 |
47 |
- |
725 |
(1) |
(3) |
(14) |
- |
(18) |
| - wholesale and retail trade, repair of motor vehicles and motorcycles |
8,397 |
645 |
178 |
1 |
9,221 |
(4) |
(6) |
(114) |
- |
(124) |
| - transportation and storage |
2,980 |
1,418 |
157 |
- |
4,555 |
(6) |
(13) |
(56) |
- |
(75) |
| - accommodation and food |
668 |
209 |
46 |
- |
923 |
(2) |
(5) |
(11) |
- |
(18) |
| - publishing, audiovisual and broadcasting |
3,292 |
90 |
36 |
- |
3,418 |
(2) |
(1) |
(14) |
- |
(17) |
| - real estate |
3,955 |
784 |
199 |
- |
4,938 |
(5) |
(16) |
(124) |
- |
(145) |
| - professional, scientific and technical activities |
2,568 |
564 |
211 |
- |
3,343 |
(2) |
(12) |
(95) |
- |
(109) |
| - administrative and support services |
8,177 |
957 |
312 |
- |
9,446 |
(7) |
(38) |
(173) |
- |
(218) |
| - public administration and defence, compulsory social security |
33 |
- |
- |
- |
33 |
- |
- |
- |
- |
- |
| - education |
30 |
4 |
3 |
- |
37 |
- |
- |
(1) |
- |
(1) |
| - health and care |
153 |
25 |
88 |
- |
266 |
- |
(1) |
(49) |
- |
(50) |
| - arts, entertainment and recreation |
86 |
70 |
5 |
- |
161 |
- |
(2) |
(2) |
- |
(4) |
| - other services |
1,330 |
38 |
76 |
- |
1,444 |
(1) |
- |
(19) |
- |
(20) |
| - activities of households |
3 |
- |
- |
- |
3 |
- |
- |
- |
- |
- |
| - extra-territorial organisations and bodies activities |
39 |
- |
- |
- |
39 |
- |
- |
- |
- |
- |
| - government |
1,255 |
137 |
64 |
- |
1,456 |
- |
- |
(2) |
- |
(2) |
| - asset-backed securities |
16 |
11 |
- |
- |
27 |
- |
(11) |
- |
- |
(11) |
| Non-bank financial institutions |
11,709 |
723 |
268 |
- |
12,700 |
(2) |
(7) |
(102) |
- |
(111) |
| Loans and advances to banks |
16,673 |
414 |
65 |
- |
17,152 |
(6) |
(21) |
(16) |
- |
(43) |
| At 31 Dec 2022 |
75,053 |
7,616 |
2,184 |
3 |
84,856 |
(48) |
(151) |
(892) |
- |
(1,091) |
| By country |
|
|
|
|
|
|
|
|
|
|
| UK |
36,885 |
2,187 |
825 |
- |
39,897 |
(15) |
(47) |
(309) |
- |
(371) |
| France |
25,940 |
3,331 |
850 |
2 |
30,123 |
(16) |
(67) |
(435) |
- |
(518) |
| Germany |
5,197 |
1,155 |
313 |
- |
6,665 |
- |
(21) |
(107) |
- |
(128) |
| Other countries |
7,031 |
943 |
196 |
1 |
8,171 |
(17) |
(16) |
(41) |
- |
(74) |
| At 31 Dec 2022 |
75,053 |
7,616 |
2,184 |
3 |
84,856 |
(48) |
(151) |
(892) |
- |
(1,091) |
| Total wholesale lending for loans and other credit-related commitments and financial guarantees1 by stage distribution |
||||||||||
|
|
Nominal amount |
Allowance for ECL |
||||||||
|
|
Stage 1 |
Stage 2 |
Stage 3 |
POCI |
Total |
Stage 1 |
Stage 2 |
Stage 3 |
POCI |
Total |
| The group
|
£m |
£m |
£m |
£m |
£m |
£m |
£m |
£m |
£m |
£m |
| Corporate and commercial |
63,605 |
8,012 |
239 |
- |
71,856 |
(13) |
(29) |
(39) |
- |
(81) |
| Financial |
56,080 |
1,707 |
2 |
- |
57,789 |
(1) |
(5) |
- |
- |
(6) |
| At 31 Dec 2022 |
119,685 |
9,719 |
241 |
- |
129,645 |
(14) |
(34) |
(39) |
- |
(87) |
| By geography |
|
|
|
|
|
|
|
|
|
|
| Europe |
119,685 |
9,719 |
241 |
- |
129,645 |
(14) |
(34) |
(39) |
- |
(87) |
| - of which: UK |
29,090 |
3,665 |
59 |
- |
32,814 |
(9) |
(17) |
(7) |
- |
(33) |
| - of which: France |
75,886 |
2,796 |
38 |
- |
78,720 |
(2) |
(5) |
(14) |
- |
(21) |
| - of which: Germany |
10,748 |
2,749 |
100 |
- |
13,597 |
(1) |
(11) |
- |
- |
(12) |
1 Excludes performance guarantee contracts to which the impairment requirements in IFRS 9 are not applied.
| Total wholesale lending for loans and advances to banks and customers by stage distribution (continued) |
||||||||||
|
|
Gross carrying amount |
Allowance for ECL |
||||||||
|
|
Stage 1 |
Stage 2 |
Stage 3 |
POCI |
Total |
Stage 1 |
Stage 2 |
Stage 3 |
POCI |
Total |
| The group |
£m |
£m |
£m |
£m |
£m |
£m |
£m |
£m |
£m |
£m |
| Corporate and commercial |
46,237 |
8,066 |
1,782 |
2 |
56,087 |
(58) |
(137) |
(767) |
(2) |
(964) |
| - agriculture, forestry and fishing |
157 |
7 |
7 |
- |
171 |
- |
- |
(5) |
- |
(5) |
| - mining and quarrying |
1,207 |
86 |
58 |
- |
1,351 |
(1) |
(1) |
(5) |
- |
(7) |
| - manufacture |
7,327 |
1,624 |
281 |
2 |
9,234 |
(8) |
(14) |
(72) |
(2) |
(96) |
| - electricity, gas, steam and air- conditioning supply |
2,891 |
49 |
30 |
- |
2,970 |
(3) |
(1) |
(4) |
- |
(8) |
| - water supply, sewerage, waste management and remediation |
215 |
- |
4 |
- |
219 |
- |
- |
(4) |
- |
(4) |
| - construction |
641 |
116 |
97 |
- |
854 |
(2) |
(2) |
(40) |
- |
(44) |
| - wholesale and retail trade, repair of motor vehicles and motorcycles |
7,743 |
889 |
192 |
- |
8,824 |
(4) |
(8) |
(132) |
- |
(144) |
| - transportation and storage |
3,254 |
1,570 |
205 |
- |
5,029 |
(9) |
(20) |
(56) |
- |
(85) |
| - accommodation and food |
831 |
409 |
80 |
- |
1,320 |
(4) |
(10) |
(20) |
- |
(34) |
| - publishing, audiovisual and broadcasting |
2,390 |
81 |
50 |
- |
2,521 |
(2) |
(2) |
(12) |
- |
(16) |
| - real estate |
4,849 |
891 |
280 |
- |
6,020 |
(9) |
(32) |
(159) |
- |
(200) |
| - professional, scientific and technical activities |
2,522 |
669 |
221 |
- |
3,412 |
(3) |
(8) |
(60) |
- |
(71) |
| - administrative and support services |
8,765 |
1,204 |
178 |
- |
10,147 |
(9) |
(21) |
(161) |
- |
(191) |
| - public administration and defence, compulsory social security |
376 |
180 |
- |
- |
556 |
- |
- |
- |
- |
- |
| - education |
22 |
5 |
3 |
- |
30 |
- |
(1) |
(1) |
- |
(2) |
| - health and care |
473 |
47 |
6 |
- |
526 |
(1) |
(4) |
(5) |
- |
(10) |
| - arts, entertainment and recreation |
104 |
116 |
5 |
- |
225 |
- |
(3) |
(3) |
- |
(6) |
| - other services |
1,427 |
66 |
85 |
- |
1,578 |
(3) |
(2) |
(28) |
- |
(33) |
| - activities of households |
- |
2 |
- |
- |
2 |
- |
- |
- |
- |
- |
| - government |
1,027 |
45 |
- |
- |
1,072 |
- |
- |
- |
- |
- |
| - asset-backed securities |
16 |
10 |
- |
- |
26 |
- |
(8) |
- |
- |
(8) |
| Non-bank financial institutions |
10,238 |
369 |
243 |
- |
10,850 |
(6) |
(5) |
(16) |
- |
(27) |
| Loans and advances to banks |
10,750 |
39 |
- |
- |
10,789 |
(4) |
(1) |
- |
- |
(5) |
| At 31 Dec 2021 |
67,225 |
8,474 |
2,025 |
2 |
77,726 |
(68) |
(143) |
(783) |
(2) |
(996) |
| By country |
|
|
|
|
|
|
|
|
|
|
| UK |
27,765 |
3,001 |
832 |
- |
31,598 |
(34) |
(43) |
(233) |
- |
(310) |
| France |
29,287 |
3,492 |
572 |
1 |
33,352 |
(27) |
(62) |
(396) |
(1) |
(486) |
| Germany |
4,628 |
1,175 |
328 |
- |
6,131 |
- |
(17) |
(73) |
- |
(90) |
| Other countries |
5,545 |
806 |
293 |
1 |
6,645 |
(7) |
(21) |
(81) |
(1) |
(110) |
| At 31 Dec 2021 |
67,225 |
8,474 |
2,025 |
2 |
77,726 |
(68) |
(143) |
(783) |
(2) |
(996) |
.
| Total wholesale lending for loans and other credit-related commitments and financial guarantees1 by stage distribution (continued) |
||||||||||
|
|
Nominal amount |
Allowance for ECL |
||||||||
|
|
Stage 1 |
Stage 2 |
Stage 3 |
POCI |
Total |
Stage 1 |
Stage 2 |
Stage 3 |
POCI |
Total |
| The group |
£m |
£m |
£m |
£m |
£m |
£m |
£m |
£m |
£m |
£m |
| Corporate and commercial |
65,582 |
7,369 |
295 |
- |
73,246 |
(22) |
(27) |
(15) |
- |
(64) |
| Financial |
50,380 |
826 |
2 |
- |
51,208 |
(5) |
(2) |
- |
- |
(7) |
| At 31 Dec 2021 |
115,962 |
8,195 |
297 |
- |
124,454 |
(27) |
(29) |
(15) |
- |
(71) |
| By geography |
|
|
|
|
|
|
|
|
|
|
| Europe |
115,962 |
8,195 |
297 |
- |
124,454 |
(27) |
(29) |
(15) |
- |
(71) |
| - of which: UK |
25,662 |
2,910 |
87 |
- |
28,659 |
(16) |
(11) |
(3) |
- |
(30) |
| - of which: France |
77,664 |
1,273 |
37 |
- |
78,974 |
(3) |
(3) |
(4) |
- |
(10) |
| - of which: Germany |
10,113 |
3,693 |
127 |
- |
13,933 |
(4) |
(8) |
(1) |
- |
(13) |
1 Excludes performance guarantee contracts to which the impairment requirements in IFRS 9 are not applied.
Collateral and other credit enhancement
(Audited)
Although collateral can be an important mitigant of credit risk, it is the group's practice to lend on the basis of the customer's ability to meet their obligations out of cash flow resources rather than placing primary reliance on collateral and other credit risk enhancements. Depending on the customer's standing and the type of product, facilities may be provided without any collateral or other credit enhancements. For other lending, a charge over collateral is obtained and considered in determining the credit decision and pricing. In the event of default, the group may utilise the collateral as a source of repayment.
Depending on its form, collateral can have a significant financial effect in mitigating our exposure to credit risk. Where there is sufficient collateral, an expected credit loss is not recognised. This is the case for reverse repos and for certain loans and advances to customers where the loan to value ('LTV') is very low.
Mitigants may include a charge on borrowers' specific assets, such as real estate or financial instruments. Other credit risk mitigants include short positions in securities and financial assets held as part of linked insurance/investment contracts where the risk is predominantly borne by the policyholder. Additionally, risk may be managed by employing other types of collateral and credit risk enhancements, such as second charges, other liens and unsupported guarantees. Guarantees are normally taken from corporates and export credit agencies. Corporates would normally provide guarantees as part of a parent/subsidiary relationship and span a number of credit grades. The export credit agencies will normally be investment grade.
Certain credit mitigants are used strategically in portfolio management activities. While single name concentrations arise in portfolios managed by Global Banking and Commercial Banking, it is only in Global Banking that their size requires the use of portfolio level credit mitigants. Across Global Banking, risk limits and utilisations, maturity profiles and risk quality are monitored and managed proactively. This process is key to the setting of risk appetite for these larger, more complex, geographically distributed customer groups. While the principal form of risk management continues to be at the point of exposure origination, through the lending decision-making process, Global Banking also utilises loan sales and credit default swap ('CDS') hedges to manage concentrations and reduce risk. These transactions are the responsibility of a dedicated Global Banking portfolio management team. Hedging activity is carried out within agreed credit parameters, and is subject to market risk limits and a robust governance structure. Where applicable, CDSs are entered into directly with a central clearing house counterparty.
Otherwise our exposure to CDS protection providers is diversified among mainly banking counterparties with strong credit ratings.
CDS mitigants are held at portfolio level and are not included in the expected loss calculations. CDS mitigants are not reported in the following tables.
Collateral on loans and advances
The following tables include off-balance sheet loan commitments, primarily undrawn credit lines.
The collateral measured in the following tables consists of charges over cash and marketable financial instruments. The values in the tables represent the expected market value on an open market basis. No adjustment has been made to the collateral for any expected costs of recovery. Marketable securities are measured at their fair value.
Other types of collateral such as unsupported guarantees and floating charges over the assets of a customer's business are not measured in the following tables. While such mitigants have value, often providing rights in insolvency, their assignable value is not sufficiently certain and they are therefore assigned no value for disclosure purposes.
The LTV ratios presented are calculated by directly associating loans and advances with the collateral that individually and uniquely supports each facility. When collateral assets are shared by multiple loans and advances, whether specifically or, more generally, by way of an all monies charge, the collateral value is pro-rated across the loans and advances protected by the collateral.
For credit-impaired loans, the collateral values cannot be directly compared with impairment allowances recognised. The LTV figures use open market values with no adjustments. Impairment allowances are calculated on a different basis, by considering other cash flows and adjusting collateral values for costs of realising collateral as explained further on page 129.
Other corporate, commercial and financial (non-bank) loans and advances
Other corporate, commercial and financial (non-bank) loans are analysed separately in the following table, which focuses on the countries containing the majority of our loans and advances balances. For financing activities in other corporate and commercial lending, collateral value is not strongly correlated to principal repayment performance.
Collateral values are generally refreshed when an obligor's general credit performance deteriorates and we have to assess the likely performance of secondary sources of repayment should it prove necessary to rely on them.
| Wholesale lending - corporate, commercial and financial (non-bank) loans and advances including loan commitments by level of collateral for key countries by stage (excluding commercial real estate) |
||||||||
| (Audited) |
||||||||
|
|
|
|
of which: |
|||||
|
|
Total |
UK |
France |
Germany |
||||
|
|
Gross carrying/nominal amount |
ECL coverage |
Gross carrying/nominal amount |
ECL coverage |
Gross carrying/nominal amount |
ECL coverage |
Gross carrying/nominal amount |
ECL coverage |
| The group |
£m |
% |
£m |
% |
£m |
% |
£m |
% |
| Stage 1 |
|
|
|
|
|
|
|
|
| Not collateralised |
117,166 |
- |
46,080 |
- |
53,960 |
- |
11,577 |
- |
| Fully collateralised |
10,444 |
0.1 |
6,300 |
0.1 |
2,146 |
- |
809 |
- |
| LTV ratio: |
|
|
|
|
|
|
|
|
| - less than 50% |
2,456 |
0.2 |
1,643 |
0.2 |
491 |
- |
- |
- |
| - 51% to 75% |
3,321 |
0.1 |
2,161 |
- |
1,050 |
- |
- |
- |
| - 76% to 90% |
354 |
- |
234 |
- |
36 |
- |
- |
- |
| - 91% to 100% |
4,313 |
- |
2,262 |
- |
569 |
- |
809 |
- |
| Partially collateralised (A): |
4,542 |
0.1 |
169 |
- |
3,797 |
0.1 |
- |
- |
| - collateral value on A |
3,664 |
|
77 |
|
3,128 |
|
- |
|
| Total |
132,152 |
- |
52,549 |
- |
59,903 |
- |
12,386 |
- |
| Stage 2 |
|
|
|
|
|
|
|
|
| Not collateralised |
13,074 |
0.9 |
4,219 |
0.8 |
4,581 |
1.0 |
3,269 |
0.9 |
| Fully collateralised |
1,132 |
1.5 |
327 |
1.2 |
239 |
1.7 |
228 |
0.9 |
| LTV ratio: |
|
|
|
|
|
|
|
|
| - less than 50% |
515 |
1.7 |
224 |
0.4 |
122 |
0.8 |
- |
- |
| - 51% to 75% |
272 |
1.5 |
84 |
3.6 |
69 |
1.4 |
- |
- |
| - 76% to 90% |
4 |
- |
2 |
- |
1 |
- |
- |
- |
| - 91% to 100% |
341 |
1.2 |
17 |
- |
47 |
4.3 |
228 |
0.9 |
| Partially collateralised (B): |
509 |
1.4 |
23 |
- |
472 |
1.5 |
- |
- |
| - collateral value on B |
426 |
|
13 |
|
405 |
|
- |
|
| Total |
14,715 |
1.0 |
4,569 |
0.8 |
5,292 |
1.1 |
3,497 |
0.9 |
| Stage 3 |
|
|
|
|
|
|
|
|
| Not collateralised |
1,795 |
40.3 |
673 |
31.2 |
668 |
57.9 |
348 |
28.7 |
| Fully collateralised |
80 |
26.3 |
10 |
10.0 |
12 |
33.3 |
24 |
29.2 |
| LTV ratio: |
|
|
|
|
|
|
|
|
| - less than 50% |
26 |
23.1 |
2 |
- |
7 |
28.6 |
- |
- |
| - 51% to 75% |
6 |
33.3 |
3 |
33.3 |
2 |
50.0 |
- |
- |
| - 76% to 90% |
11 |
36.4 |
2 |
- |
1 |
- |
- |
- |
| - 91% to 100% |
37 |
21.6 |
3 |
- |
2 |
50.0 |
24 |
29.2 |
| Partially collateralised (C): |
172 |
23.8 |
11 |
27.3 |
159 |
23.3 |
- |
- |
| - collateral value on C |
125 |
|
3 |
|
122 |
|
- |
|
| Total |
2,047 |
38.4 |
694 |
30.8 |
839 |
51.0 |
372 |
28.8 |
| POCI |
|
|
|
|
|
|
|
|
| Not collateralised |
2 |
- |
- |
- |
2 |
- |
- |
- |
| Fully collateralised |
- |
- |
- |
- |
- |
- |
- |
- |
| LTV ratio: |
|
|
|
|
|
|
|
|
| - less than 50% |
- |
- |
- |
- |
- |
- |
- |
- |
| - 51% to 75% |
- |
- |
- |
- |
- |
- |
- |
- |
| - 76% to 90% |
- |
- |
- |
- |
- |
- |
- |
- |
| - 91% to 100% |
- |
- |
- |
- |
- |
- |
- |
- |
| Partially collateralised (D): |
- |
- |
- |
- |
- |
- |
- |
- |
| - collateral value on D |
- |
|
- |
|
- |
|
- |
|
| Total |
2 |
- |
- |
- |
2 |
- |
- |
- |
| At 31 Dec 2022 |
148,916 |
0.7 |
57,812 |
0.5 |
66,036 |
0.8 |
16,255 |
0.9 |
| Wholesale lending - corporate, commercial and financial (non-bank) loans and advances including loan commitments by level of collateral for key countries by stage (excluding commercial real estate) (continued) |
||||||||
| (Audited) |
||||||||
|
|
|
|
of which: |
|||||
|
|
Total |
UK |
France |
Germany |
||||
|
|
Gross carrying/nominal amount |
ECL |
Gross carrying/nominal amount |
ECL |
Gross carrying/nominal amount |
ECL |
Gross carrying/nominal amount |
ECL |
| The group |
£m |
% |
£m |
% |
£m |
% |
£m |
% |
| Stage 1 |
|
|
|
|
|
|
|
|
| Not collateralised |
109,435 |
0.1 |
40,298 |
0.1 |
52,583 |
- |
11,479 |
- |
| Fully collateralised |
10,399 |
0.1 |
6,133 |
0.1 |
2,221 |
0.1 |
708 |
- |
| LTV ratio: |
|
|||||||
| - less than 50% |
2,450 |
0.2 |
1,649 |
0.1 |
587 |
- |
- |
- |
| - 51% to 75% |
3,543 |
0.1 |
2,124 |
0.0 |
989 |
0.1 |
- |
- |
| - 76% to 90% |
801 |
0.1 |
446 |
0.0 |
349 |
- |
- |
- |
| - 91% to 100% |
3,605 |
- |
1,914 |
- |
296 |
- |
708 |
- |
| Partially collateralised (A): |
3,424 |
0.1 |
85 |
- |
3,248 |
0.1 |
- |
- |
| - collateral value on A |
2,661 |
|
51 |
|
2,555 |
|
- |
|
| Total |
123,258 |
0.1 |
46,516 |
0.1 |
58,052 |
- |
12,187 |
- |
| Stage 2 |
|
|
|
|
|
|
|
|
| Not collateralised |
11,024 |
0.9 |
4,365 |
0.9 |
1,890 |
1.5 |
3,942 |
0.6 |
| Fully collateralised |
1,675 |
1.1 |
608 |
0.8 |
639.4 |
1.1 |
243 |
0.4 |
| LTV ratio: |
|
|||||||
| - less than 50% |
689 |
1.7 |
217 |
1.4 |
350 |
1.1 |
- |
- |
| - 51% to 75% |
253 |
0.8 |
217 |
0.9 |
34 |
2.9 |
- |
- |
| - 76% to 90% |
271 |
0.4 |
165 |
0.0 |
106 |
0.9 |
- |
- |
| - 91% to 100% |
462 |
0.9 |
9 |
- |
149 |
1.3 |
243 |
0.4 |
| Partially collateralised (B): |
1,573.2 |
0.9 |
4 |
0.0 |
1,567 |
0.9 |
- |
- |
| - collateral value on B |
1,408 |
|
3 |
|
1,404 |
|
- |
|
| Total |
14,272 |
0.9 |
4,977 |
0.9 |
4,096.4 |
1.2 |
4,185 |
0.5 |
| Stage 3 |
|
|
|
|
|
|
|
|
| Not collateralised |
1,598 |
37.2 |
669 |
25.1 |
378 |
86.0 |
393 |
17.8 |
| Fully collateralised |
148 |
16.2 |
77 |
7.8 |
10 |
50.0 |
24 |
16.7 |
| LTV ratio: |
|
|||||||
| - less than 50% |
76 |
18.4 |
41 |
7.3 |
6 |
50.0 |
- |
- |
| - 51% to 75% |
22 |
13.6 |
19 |
10.5 |
2 |
50.0 |
- |
- |
| - 76% to 90% |
18 |
5.6 |
17 |
- |
1 |
- |
- |
- |
| - 91% to 100% |
32 |
15.6 |
- |
- |
1 |
100.0 |
24 |
16.7 |
| Partially collateralised (C): |
216 |
27.3 |
35 |
17.1 |
165 |
27.3 |
- |
- |
| - collateral value on C |
152 |
|
22 |
|
123 |
|
- |
|
| Total |
1,962 |
34.6 |
781 |
23.0 |
553 |
67.8 |
417 |
17.7 |
| POCI |
|
|
|
|
|
|
|
|
| Not collateralised |
- |
- |
- |
- |
- |
- |
- |
- |
| Fully collateralised |
- |
- |
- |
- |
- |
- |
- |
- |
| LTV ratio: |
|
|||||||
| - less than 50% |
- |
- |
- |
- |
- |
- |
- |
- |
| - 51% to 75% |
- |
- |
- |
- |
- |
- |
- |
- |
| - 76% to 90% |
- |
- |
- |
- |
- |
- |
- |
- |
| - 91% to 100% |
- |
- |
- |
- |
- |
- |
- |
- |
| Partially collateralised (D): |
2 |
100.0 |
- |
- |
2 |
100.0 |
- |
- |
| - collateral value on D |
2 |
|
- |
|
2 |
|
- |
|
| Total |
2 |
100.0 |
- |
- |
2 |
100.0 |
- |
- |
| At 31 Dec 2021 |
139,494 |
0.6 |
52,274 |
0.5 |
62,703 |
0.7 |
16,789 |
0.6 |
.
Other credit risk exposures
In addition to collateralised lending, other credit enhancements are employed and methods used to mitigate credit risk arising from financial assets. These are described in more detail below:
• Some securities issued by governments, banks and other financial institutions benefit from additional credit enhancement provided by government guarantees that cover the assets;
• Debt securities issued by banks and financial institutions include asset-backed securities ('ABSs') and similar instruments which are supported by underlying pools of financial assets. Credit risk associated with ABSs is reduced through the purchase of credit default swap ('CDS') protection;
• Trading loan and advances mainly pledged against cash collaterals are posted to satisfy margin requirements. There is limited credit risk on trading loans and advances since in the event of default of the counterparty these would be set off against the related liability. Reverse repos and stock borrowings are by their nature collateralised.
Collateral accepted as security that the group is permitted to sell or repledge under these arrangements is described on page 165 of the financial statements.
• The group's maximum exposure to credit risk includes financial guarantees and similar contracts granted; as well as loan and other credit-related commitments. Depending on the terms of the arrangement, we may use additional credit mitigation if a guarantee is called upon or a loan commitment is drawn and subsequently defaults.
For further information on these arrangements, see Note 30 on the financial statements.
Derivatives
We participate in transactions exposing us to counterparty credit risk. Counterparty credit risk is the risk of financial loss if the counterparty to a transaction defaults before satisfactorily settling it. It arises principally from over-the-counter ('OTC') derivatives and securities financing transactions and is calculated in both the trading and non-trading books. Transactions vary in value by reference to market factors such as interest rates, exchange rates or asset prices.
The counterparty risk from derivative transactions is taken into account when reporting the fair value of derivative positions. The adjustment to the fair value is known as the credit value adjustment ('CVA').
The International Swaps and Derivatives Association ('ISDA') master agreement is our preferred agreement for documenting derivatives activity. It is common, and our preferred practice, for the parties involved in a derivative transaction to execute a credit support annex ('CSA') in conjunction with the ISDA master agreement. Under a CSA, collateral is passed between the parties to mitigate the counterparty risk inherent in outstanding positions. The majority of our CSAs are with financial institutional clients.
We manage the counterparty exposure on our OTC derivative contracts by using collateral agreements with counterparties and
netting agreements. Currently, we do not actively manage our general OTC derivative counterparty exposure in the credit markets, although we may manage individual exposures in certain circumstances.
We place strict policy restrictions on collateral types and as a consequence the types of collateral received and pledged are, by value, highly liquid and of a strong quality, being predominantly cash.
Where a collateral type is required to be approved outside the collateral policy, approval is required from a committee of senior representatives from Markets, Legal and Risk.
See Note 28 on the financial statements for details regarding legally enforceable right of offset in the event of counterparty default and collateral received in respect of derivatives.
Personal lending
This section provides further details on the countries and products comprising personal loans and advances to customers.
Further product granularity is also provided by stage, with geographical data presented for loans and advances to customers, loan and other credit-related commitments, and financial guarantees.
| Total personal lending for loans and advances to customers at amortised costs by stage distribution |
||||||||
|
|
Gross Carrying amount |
Allowance for ECL |
||||||
|
|
Stage 1 |
Stage 2 |
Stage 3 |
Total |
Stage 1 |
Stage 2 |
Stage 3 |
Total |
| The group |
£m |
£m |
£m |
£m |
£m |
£m |
£m |
£m |
| By portfolio |
|
|
|
|
|
|
|
|
| First lien residential mortgages |
4,155 |
511 |
81 |
4,747 |
(7) |
(7) |
(22) |
(36) |
| - of which: |
878 |
53 |
30 |
961 |
- |
(1) |
(12) |
(13) |
| - affordability including ARMs |
353 |
6 |
- |
359 |
(1) |
(1) |
- |
(2) |
| Other personal lending |
1,138 |
104 |
24 |
1,266 |
(2) |
(8) |
(9) |
(19) |
| - guaranteed loans in respect of residential property |
- |
- |
- |
- |
- |
- |
- |
- |
| - Other personal lending which is secured |
982 |
70 |
9 |
1,061 |
(1) |
(4) |
(2) |
(7) |
| - credit cards |
61 |
23 |
7 |
91 |
- |
(2) |
- |
(2) |
| - Other personal lending which is unsecured |
95 |
11 |
8 |
114 |
(1) |
(2) |
(7) |
(10) |
| At 31 Dec 2022 |
5,293 |
615 |
105 |
6,013 |
(9) |
(15) |
(31) |
(55) |
| By geography |
|
|
|
|
|
|
|
|
| UK1 |
3,090 |
482 |
13 |
3,585 |
(2) |
(9) |
(3) |
(14) |
| France |
50 |
3 |
36 |
89 |
- |
- |
(17) |
(17) |
| Germany |
163 |
32 |
- |
195 |
- |
- |
- |
- |
| Other countries |
1,990 |
98 |
56 |
2,144 |
(7) |
(6) |
(11) |
(24) |
| At 31 Dec 2022 |
5,293 |
615 |
105 |
6,013 |
(9) |
(15) |
(31) |
(55) |
| Total personal lending for loans and other credit-related commitments and financial guarantees2 by stage distribution |
||||||||
|
|
Nominal amount |
Allowance for ECL |
||||||
|
|
Stage 1 |
Stage 2 |
Stage 3 |
Total |
Stage 1 |
Stage 2 |
Stage 3 |
Total |
| The group
|
£m |
£m |
£m |
£m |
£m |
£m |
£m |
£m |
| UK |
875 |
11 |
2 |
888 |
- |
- |
- |
- |
| France |
637 |
32 |
3 |
672 |
- |
- |
- |
- |
| Germany |
155 |
57 |
- |
212 |
- |
- |
- |
- |
| Other countries |
357 |
9 |
1 |
367 |
- |
- |
- |
- |
| At 31 Dec 2022 |
2,024 |
109 |
6 |
2,139 |
- |
- |
- |
- |
1 Includes primarily first lien residential mortgages in Channel Islands and Isle of Man.
2 Excludes performance guarantee contracts to which the impairment requirements in IFRS 9 are not applied.
| Total personal lending for loans and advances to customers at amortised costs by stage distribution (continued) |
||||||||
|
|
Gross carrying amount |
Allowance for ECL |
||||||
|
|
Stage 1 |
Stage 2 |
Stage 3 |
Total |
Stage 1 |
Stage 2 |
Stage 3 |
Total |
| The group |
£m |
£m |
£m |
£m |
£m |
£m |
£m |
£m |
| By portfolio |
|
|
|
|
|
|
|
|
| First lien residential mortgages |
6,723 |
173 |
234 |
7,130 |
(11) |
(5) |
(65) |
(81) |
| - of which: |
3,134 |
115 |
94 |
3,343 |
(1) |
(2) |
(27) |
(30) |
| - affordability including ARMs |
451 |
2 |
6 |
459 |
(3) |
- |
(1) |
(4) |
| Other personal lending |
17,532 |
513 |
219 |
18,264 |
(11) |
(11) |
(60) |
(82) |
| - guaranteed loans in respect of residential property |
14,387 |
332 |
38 |
14,757 |
(5) |
(2) |
(1) |
(8) |
| - Other personal lending which is secured |
2,535 |
136 |
100 |
2,771 |
(3) |
(4) |
(24) |
(31) |
| - credit cards |
318 |
22 |
11 |
351 |
(1) |
(2) |
(1) |
(4) |
| - Other personal lending which is unsecured |
292 |
23 |
70 |
385 |
(2) |
(3) |
(34) |
(39) |
| At 31 Dec 2021 |
24,255 |
686 |
453 |
25,394 |
(22) |
(16) |
(125) |
(163) |
| By geography |
|
|
|
|
|
|
|
|
| UK1 |
3,543 |
88 |
49 |
3,680 |
(1) |
(3) |
(3) |
(7) |
| France |
18,500 |
497 |
239 |
19,236 |
(10) |
(10) |
(75) |
(95) |
| Germany |
161 |
47 |
- |
208 |
- |
- |
- |
- |
| Other countries |
2,051 |
54 |
165 |
2,270 |
(11) |
(3) |
(47) |
(61) |
| At 31 Dec 2021 |
24,255 |
686 |
453 |
25,394 |
(22) |
(16) |
(125) |
(163) |
| Total personal lending for loans and other credit-related commitments and financial guarantees2 by stage distribution (continued) |
||||||||
|
|
Nominal amount |
Allowance for ECL |
||||||
|
|
Stage 1 |
Stage 2 |
Stage 3 |
Total |
Stage 1 |
Stage 2 |
Stage 3 |
Total |
| The group |
£m |
£m |
£m |
£m |
£m |
£m |
£m |
£m |
| UK |
586 |
3 |
2 |
591 |
- |
- |
- |
- |
| France |
1,076 |
20 |
2 |
1,098 |
- |
- |
- |
- |
| Germany |
136 |
85 |
- |
221 |
- |
- |
- |
- |
| Other countries |
377 |
8 |
- |
385 |
(1) |
- |
- |
(1) |
| At 31 Dec 2021 |
2,175 |
116 |
4 |
2,295 |
(1) |
- |
- |
(1) |
1 Includes primarily first lien residential mortgages in Channel Islands and Isle of Man.
2 Excludes performance guarantee contracts to which the impairment requirements in IFRS 9 are not applied.
Collateral on loans and advances
The following table provides a quantification of the value of fixed charges we hold over specific assets where we have a history of enforcing, and are able to enforce, collateral in satisfying a debt in the event of the borrower failing to meet its contractual obligations, and where the collateral is cash or can be realised by sale in an established market.
The collateral valuation excludes any adjustment for obtaining and selling the collateral and in particular loans shown as collateralised or partially collateralised may also benefit from other forms of credit mitigants.
| Personal lending: residential mortgage loans including loan commitments by level of collateral for key countries |
||||||
| (Audited) |
||||||
|
|
|
|
of which: |
|||
|
|
Total |
UK |
France |
|||
|
|
Gross exposure |
ECL coverage |
Gross exposure |
ECL coverage |
Gross exposure |
ECL coverage |
| The group |
£m |
% |
£m |
% |
£m |
% |
| Stage 1 |
|
|
|
|
|
|
| Fully collateralised |
4,340 |
0.1 |
2,376 |
- |
3 |
- |
| LTV ratio: |
|
|
|
|
|
|
| - less than 50% |
2,199 |
0.1 |
1,255 |
- |
3 |
- |
| - 51% to 60% |
744 |
0.1 |
429 |
- |
- |
- |
| - 61% to 70% |
738 |
0.3 |
420 |
0.2 |
- |
- |
| - 71% to 80% |
442 |
0.2 |
198 |
- |
- |
- |
| - 81% to 90% |
202 |
- |
63 |
- |
- |
- |
| - 91% to 100% |
15 |
- |
11 |
- |
- |
- |
| Partially collateralised (A): |
50 |
- |
11 |
- |
- |
- |
| LTV ratio: |
|
|
|
|
|
|
| - 101% to 110% |
4 |
- |
3 |
- |
- |
- |
| - 111% to 120% |
3 |
- |
1 |
- |
- |
- |
| - greater than 120% |
43 |
- |
7 |
- |
- |
- |
| - collateral value on A |
10 |
|
6 |
|
- |
|
| Total |
4,390 |
0.1 |
2,387 |
- |
3 |
- |
| Stage 2 |
|
|
|
|
|
|
| Fully collateralised |
510 |
1.4 |
428 |
0.5 |
- |
- |
| LTV ratio: |
|
|
|
|
|
|
| - less than 50% |
203 |
1.5 |
151 |
0.7 |
- |
- |
| - 51% to 60% |
105 |
1.9 |
90 |
1.1 |
- |
- |
| - 61% to 70% |
91 |
1.1 |
83 |
- |
- |
- |
| - 71% to 80% |
66 |
1.5 |
60 |
- |
- |
- |
| - 81% to 90% |
39 |
- |
38 |
- |
- |
- |
| - 91% to 100% |
6 |
- |
6 |
- |
- |
- |
| Partially collateralised (B): |
1 |
- |
1 |
- |
- |
- |
| LTV ratio: |
|
|
|
|
|
|
| - 101% to 110% |
1 |
- |
1 |
- |
- |
- |
| - 111% to 120% |
- |
- |
- |
- |
- |
- |
| - greater than 120% |
- |
- |
- |
- |
- |
- |
| - collateral value on B |
1 |
|
1 |
|
- |
|
| Total |
511 |
1.4 |
429 |
0.5 |
- |
- |
| Stage 3 |
|
|
|
|
|
|
| Fully collateralised |
65 |
16.9 |
10 |
10.0 |
7 |
14.3 |
| LTV ratio: |
|
|
|
|
|
|
| - less than 50% |
46 |
13.0 |
9 |
11.1 |
- |
- |
| - 51% to 60% |
5 |
20.0 |
1 |
- |
- |
- |
| - 61% to 70% |
9 |
22.2 |
- |
- |
6 |
- |
| - 71% to 80% |
3 |
33.3 |
- |
- |
- |
- |
| - 81% to 90% |
1 |
- |
- |
- |
- |
- |
| - 91% to 100% |
1 |
100.0 |
- |
- |
1 |
100.0 |
| Partially collateralised (C): |
16 |
68.8 |
- |
- |
16 |
62.5 |
| LTV ratio: |
|
|
|
|
|
|
| - 101% to 110% |
- |
- |
- |
- |
- |
- |
| - 111% to 120% |
- |
- |
- |
- |
- |
- |
| - greater than 120% |
16 |
68.8 |
- |
- |
16 |
62.5 |
| - collateral value on C |
- |
|
- |
|
- |
|
| Total |
81 |
27.2 |
10 |
10.0 |
23 |
47.8 |
| At 31 Dec 2022 |
4,982 |
0.7 |
2,826 |
0.1 |
26 |
42.3 |
| Personal lending: residential mortgage loans including loan commitments by level of collateral for key countries (continued) |
||||||
| (Audited) |
||||||
|
|
|
|
of which: |
|||
|
|
Total |
UK |
France |
|||
|
|
Gross exposure |
ECL coverage |
Gross exposure |
ECL coverage |
Gross exposure |
ECL coverage |
| The group |
£m |
% |
£m |
% |
£m |
% |
| Stage 1 |
|
|
|
|
|
|
| Fully collateralised |
6,915 |
0.2 |
2,789 |
- |
2,088 |
- |
| LTV ratio: |
|
|
|
|
|
|
| - less than 50% |
3,400 |
0.1 |
1,308 |
- |
1,110 |
0.1 |
| - 51% to 60% |
1,274 |
0.2 |
540 |
- |
431 |
- |
| - 61% to 70% |
1,074 |
0.2 |
452 |
- |
296 |
- |
| - 71% to 80% |
776 |
0.3 |
358 |
- |
177 |
- |
| - 81% to 90% |
345 |
0.3 |
113 |
- |
48 |
- |
| - 91% to 100% |
46 |
- |
18 |
- |
26 |
- |
| Partially collateralised (A): |
90 |
- |
11 |
- |
50 |
- |
| LTV ratio: |
|
|
|
|
|
|
| - 101% to 110% |
18 |
- |
2 |
- |
12 |
- |
| - 111% to 120% |
9 |
- |
1 |
- |
5 |
- |
| - greater than 120% |
63 |
- |
8 |
- |
33 |
- |
| - collateral value on A |
63 |
|
4 |
|
50 |
|
| Total |
7,005 |
0.2 |
2,800 |
- |
2,138 |
- |
| Stage 2 |
|
|
|
|
|
|
| Fully collateralised |
169 |
3.0 |
46 |
- |
83 |
1.2 |
| LTV ratio: |
|
|
|
|
|
|
| - less than 50% |
91 |
2.2 |
18 |
- |
48 |
2.1 |
| - 51% to 60% |
25 |
4.0 |
6 |
- |
13 |
- |
| - 61% to 70% |
34 |
2.9 |
17 |
- |
12 |
- |
| - 71% to 80% |
15 |
6.7 |
5 |
- |
7 |
- |
| - 81% to 90% |
3 |
- |
- |
- |
2 |
- |
| - 91% to 100% |
1 |
- |
- |
- |
1 |
- |
| Partially collateralised (B): |
5 |
- |
- |
- |
2 |
- |
| LTV ratio: |
|
|
|
|
|
|
| - 101% to 110% |
1 |
- |
- |
- |
- |
- |
| - 111% to 120% |
1 |
- |
- |
- |
- |
- |
| - greater than 120% |
3 |
- |
- |
- |
2 |
- |
| - collateral value on B |
4 |
|
- |
|
3 |
|
| Total |
174 |
2.9 |
46 |
- |
85 |
1.2 |
| Stage 3 |
|
|
|
|
|
|
| Fully collateralised |
204 |
24.5 |
9 |
11.1 |
62 |
21.0 |
| LTV ratio: |
|
|
|
|
|
|
| - less than 50% |
94 |
12.8 |
6 |
16.7 |
24 |
20.8 |
| - 51% to 60% |
31 |
19.4 |
3 |
- |
8 |
25.0 |
| - 61% to 70% |
34 |
23.5 |
- |
- |
19 |
10.5 |
| - 71% to 80% |
13 |
38.5 |
- |
- |
3 |
33.3 |
| - 81% to 90% |
14 |
42.9 |
- |
- |
4 |
25.0 |
| - 91% to 100% |
18 |
72.2 |
- |
- |
4 |
50.0 |
| Partially collateralised (C): |
30 |
53.3 |
- |
- |
24 |
58.3 |
| LTV ratio: |
|
|
|
|
|
|
| - 101% to 110% |
2 |
50.0 |
- |
- |
2 |
50.0 |
| - 111% to 120% |
2 |
50.0 |
- |
- |
2 |
50.0 |
| - greater than 120% |
26 |
53.8 |
- |
- |
20 |
60.0 |
| - collateral value on C |
6 |
|
- |
|
6 |
|
| Total |
234 |
28.2 |
9 |
11.1 |
86 |
31.4 |
| At 31 Dec 2021 |
7,413 |
1.1 |
2,855 |
- |
2,309 |
1.3 |
| Treasury risk |
Overview
Treasury risk is the risk of having insufficient capital, liquidity or funding resources to meet financial obligations and satisfy regulatory requirements, as well as the risk to our earnings or capital due to structural and transactional foreign exchange exposures and changes in market interest rates, together with pension and insurance risk.
Treasury risk arises from changes to the respective resources and risk profiles driven by customer behaviour, management decisions or the external environment.
Approach and policy
(Audited)
Our objective in the management of treasury risk is to maintain appropriate levels of capital, liquidity, funding, foreign exchange and market risk to support our business strategy, and meet our regulatory and stress testing-related requirements.
Our approach to treasury management is driven by our strategic and organisational requirements, taking into account the regulatory, economic and commercial environment. We aim to maintain a strong capital and liquidity base to support the risks inherent in our business and invest in accordance with our strategy, meeting both consolidated and local regulatory requirements at all times.
Our policy is underpinned by our risk management framework. The risk management framework incorporates a number of measures aligned to our assessment of risks for both internal and regulatory purposes. These risks include credit, market, operational, pensions, structural and transactional foreign exchange risk, and interest rate risk in the banking book.
For further details, refer to our Pillar 3 Disclosures at 31 December 2022.
Treasury risk management
Key developments in 2022
• Our CET1 ratio decreased from 17.8% at 31 December 2021 to 16.8% at 31 December 2022. This included a 1.6 percentage point impact from the disposal of the retail banking operations in France and a 1.2 percentage point impact from RWA growth due to implementation of new regulations, increased volatility in the market and the impact of FX movements. Share issuance, profits and other movements added 1.8 percentage points to the ratio.
• The Group Board approved a new interest rate risk in the banking book ('IRRBB') strategy in September, with the objective of increasing our stabilisation of NII, with consideration given to any capital or other constraints, and then adopting a managed approach based on interest rates and outlook.
• We took steps to reduce the duration risk of our Treasury hold-to-collect-and-sell portfolio, which is accounted for at FVOCI primarily to reduce the capital impact from rising interest rates. This risk reduction lowered the hold-to-collect-and-sell stressed value at risk ('SVaR') exposure of this portfolio from 532m at the end of 2021 to 353m at the end of 2022.
• We implemented a new hold-to-collect business model to better reflect our management strategy to stabilise NII. This portfolio of High Quality Liquid Assets ('HQLA') will form a greater part of our liquid asset buffer going forward, as well as being a hedge to our structural interest rate risk.
• We enhanced the monitoring and forecasting of our capital positions as a result of the Russia-Ukraine war, although there were no material capital or liquidity direct impacts from the increased uncertainty on the forward economic outlook. There was also limited direct impact on our pension plans, as the most material plans had little or no direct investments in Russia or Ukraine.
• Work continued over 2022 to implement and improve de-risking strategies for our pension plans with a particular focus on asset de-risking in Germany. In light of the increased market volatility we have reviewed the investment strategies of our pension plans to ensure that they remain appropriate and the pension plans continue to cope with future volatility.
• The cost of living has continued to increase throughout Europe over 2022 and there are a number of pension risks arising from this issue. The main areas where this impacts pensions are across investment strategy, actuarial factors, pension increases and members' behaviours. We have worked with the fiduciaries of the pension plan to ensure impact to plans and members is understood and monitored.
• HBCE signed a framework agreement with Promontoria MMB SAS ('My Money Group') and its subsidiary Banque des Caraïbes SA, for the sale of its retail banking business in France. The sale, which is subject to regulatory approvals, is anticipated to complete in the second half of 2023. The impact of classifying the disposal group as held for sale resulted in a 1.6 percentage point reduction in the group's CET1 ratio, which will be partly offset by the reduction in RWAs upon closing.
• The Group performed its inaugural resolvability self-assessment to meet the BoE requirements, which came into effect on 1 January 2022. This was incorporated into the BoE publication of their findings from the first assessment of the resolvability of the eight major UK firms as part of the Resolvability Assessment Framework.
Governance and structure
The Chief Risk Officer is the accountable risk steward for all treasury risks. The Chief Financial Officer is the risk owner for treasury risks with the exception of pension risk which is co-owned together with the regional heads of Performance & Reward.
Capital, liquidity, interest rate risk in the banking book and non-trading book foreign exchange risk are the responsibility of the Executive Committee and the Risk Committee. The Treasury function actively manages these risks on an on-going basis, supported by the Asset and Liability Management Committee ('ALCO'), overseen by Treasury Risk Management and the Risk Management Meeting ('RMM').
Pension risk is overseen by the Pension Risk Management Meeting.
Capital, liquidity and funding risk management processes
Assessment and risk appetite
Our capital management policy is supported by a global capital management framework. The framework sets out approach to determining key capital risk appetites including CET1, total capital, minimum requirements for own funds and eligible liabilities ('MREL'), and leverage ratio. Our Internal Capital Adequacy Assessment process ('ICAAP') is an assessment of the group's capital position, outlining both regulatory and internal capital resources and requirements resulting from our business model, strategy, risk profile and management, performance and planning, risks to capital, and the implications of stress testing. Our assessment of capital adequacy is driven by an assessment of risks. These risks include credit, market, operational, pensions, insurance, structural foreign exchange, and interest rate risk in the banking book. Climate risk is also considered as part of the ICAAP, and we are continuing to develop our approach. The ICAAP supports the determination of our capital risk appetite and target ratios, as well as enables the assessment and determination of capital requirements by regulators. Subsidiaries prepare ICAAPs in line with global guidance, while considering their local regulatory regimes to determine their own risk appetites and ratios.
We aim to ensure that management has oversight of our liquidity and funding risks at group and entity level through robust governance, in line with our risk management framework. We manage liquidity and funding risk at an operating entity level in accordance with globally consistent policies, procedures and reporting standards. This ensures that obligations can be met in a timely manner, in the jurisdiction where they fall due.
Operating entities are required to meet internal minimum requirements and any applicable regulatory requirements at all times. These requirements are assessed through our internal liquidity adequacy assessment process ('ILAAP'), which ensures that operating entities have robust strategies, policies, processes and systems for the identification, measurement, management and monitoring of liquidity risk over an appropriate set of time horizons, including intra-day. The ILAAP informs the validation of risk tolerance and the setting of risk appetite. It also assesses the capability to manage liquidity and funding effectively. These metrics are set and managed locally but are subject to robust global review and challenge to ensure consistency of approach and application of the Group's policies and controls.
Planning and performance
Capital and risk-weighted asset ('RWA') plans form part of the annual financial resource plan that is approved by the Board. Capital and RWA forecasts are submitted to the ALCO on a monthly basis, and capital and RWAs are monitored and managed against the plan.
Through our internal governance processes, we seek to strengthen discipline over our investment and capital allocation decisions, and to ensure that returns on investment meet management's objectives. Our strategy is to allocate capital to businesses and entities to support growth objectives where returns above internal hurdle levels have been identified and in order to meet
their regulatory and economic capital needs. We evaluate and manage business returns by using a RoTE measure.
Funding and liquidity plans also form part of the financial resource plan that is approved by the Board. The Board-level appetite measures are the LCR and net stable funding ratio ('NSFR'), together with an internal liquidity metric. In addition, we use a wider set of measures to manage an appropriate funding and liquidity profile, including legal entity depositor concentration limits, intra-day liquidity, forward-looking funding assessments and other key measures.
Risks to capital and liquidity
Outside the stress testing framework, other risks may be identified that have the potential to affect our RWAs, capital and/or liquidity position. We closely monitor future regulatory changes and continue to evaluate the impact of these upon our capital and liquidity requirements, particularly those related to the UK's implementation of the outstanding measures to be implemented from the Basel III reforms ('Basel 3.1').
Regulatory developments
Our capital adequacy ratios have been affected by regulatory developments in 2022, including changes to internal-ratings based ('IRB') modelling requirements and the UK's implementation of the revisions to the Capital Requirements Regulation and Directive ('CRR II'). The PRA's final rules on NSFR were implemented and have been reflected in disclosures since the first quarter of 2022.
With effect from 1 January 2023 IFRS 17 Insurance Contracts comes into force. We expect this to reduce the group's CET1 ratio by 0.3 percentage points because we value our insurance subsidiaries under the equity method in our capital adequacy reporting. Also from the same date, the group will be subject to a binding minimum leverage ratio, set according to PRA rules.
Future changes to our ratios will occur with the implementation of Basel 3.1. The PRA published its consultation on the implementation of Basel 3.1 in the UK during the last quarter of 2022, with a proposed implementation date of 1 January 2025. The proposal includes five-year transitional provisions for certain elements of the reform.
Regulatory reporting processes and controls
The quality of regulatory reporting remains a key priority for management and regulators. We are progressing with a comprehensive programme to strengthen our processes, improve consistency and enhance controls across our prudential regulatory reporting, focussing on PRA requirements initially. We commissioned a number of independent external reviews, some at the request of our regulators, including one on our credit risk RWA reporting process, which concluded in December 2022. These reviews have so far resulted in improvements in the accuracy of reported RWAs and LCR in accordance with policies, which have been reflected in our year-end regulatory reported ratios. Our prudential regulatory reporting programme is being phased over a number of years, prioritising RWA, capital and liquidity reporting in the early stages of the programme. While this programme continues, there may be further impacts on some of our regulatory ratios, such as the CET1, LCR and NSFR, as we implement recommended changes and continue to enhance our controls across the process.
Stress testing and recovery planning
The group uses stress testing to inform management of the capital and liquidity needed to withstand internal and external shocks, including a global economic downturn or a systems failure. Stress testing results are also used to inform risk mitigation actions, allocation of financial resources, and recovery and resolution planning, as well as to re-evaluate business plans where analysis shows capital, liquidity and/or returns do not meet their target.
In addition to a range of internal stress tests, we are subject to supervisory stress testing in many jurisdictions. These include the programmes of the BoE, the EBA and the ECB. The results of regulatory stress testing and our internal stress tests are used when assessing our internal capital and liquidity requirements through the ICAAP and ILAAP. The outcomes of stress testing exercises carried out by the PRA and other regulators feed into the setting of regulatory minimum ratios and buffers.
We maintain recovery plans for the group and material entities, which set out potential options management could take in a range of stress scenarios that could result in a breach of capital or liquidity buffers. The recovery plan sets out the framework and governance arrangements to support restoring us to a stable and viable position, and so lowering the probability of failure from either idiosyncratic company-specific stress or systemic market-wide issues. Our material entities' recovery plans provide detailed actions that management would consider taking in a stress scenario should their positions deteriorate and threaten to breach risk appetite and regulatory minimum levels. This is to help ensure that entities can stabilise their financial position and recover from financial losses in a stress environment.
The group also has capabilities, resources and arrangements in place to address the unlikely event that we might not be recoverable and would therefore need to be resolved by regulators. We have contributed to the Group's inaugural resolvability assessment framework ('RAF') self-assessment during 2021 to meet the BoE's requirements, which came into effect on 1 January 2022.
Overall, our recovery and resolution planning helps safeguard the Group's financial and operational stability. The Group is committed to further developing its recovery and resolution capabilities, including in relation to the BoE's resolvability assessment framework.
Measurement of interest rate risk in the banking book
Interest rate risk in the banking book is the risk of an adverse impact to earnings or capital due to changes in market interest rates. It is generated by our non-traded assets and liabilities, specifically loans, deposits and financial instruments that are not held for trading intent or held to hedge positions held with trading intent. Interest rate risk that can be economically hedged may be transferred to the Markets Treasury business. Hedging is generally executed through interest rate derivatives or fixed-rate government bonds. Any interest rate risk that Markets Treasury cannot economically hedge is not transferred and will remain within the global business where the risks originate.
The following measures are used by Treasury to monitor and control interest rate risk in the banking book including:
• Net Interest Income ('NII') sensitivity;
• Economic Value of Equity ('EVE') Sensitivity; and
• Non-Trading Value at Risk ('VaR').
Net interest income sensitivity
A principal part of our management of non-traded interest rate risk is to monitor the sensitivity of expected Net Interest Income (NII) under varying interest rate scenarios (simulation modelling), where all other economic variables are held constant. This monitoring is undertaken at an entity level. HSBC Bank plc calculates both one-year and five-year NII sensitivities across a range of interest rate scenarios.
NII sensitivity figures represent the effect of pro forma movements in projected yield curves based on a static balance sheet size and structure. The exception to this is where the size of the balances or repricing is deemed interest rate sensitive, for example, early prepayment of mortgages. These sensitivity calculations do not incorporate actions that would be taken by Markets Treasury or in the business that originates the risk to mitigate the effect of interest rate movements.
The NII sensitivity calculations assume that interest rates of all maturities move by the same amount in the 'up-shock' scenario. The sensitivity calculations in the 'down-shock' scenarios reflect no floors to the shocked market rates.
However, customer product-specific interest rate floors are recognised where applicable.
Economic value of equity sensitivity
EVE represents the present value of the future banking book cash flows that could be distributed to equity holders under a managed run-off scenario. This equates to the current book value of equity plus the present value of future NII in this scenario. EVE can be used to assess the economic capital required to support interest rate risk in the banking book. An EVE sensitivity represents the expected movement in EVE due to pre-specified interest rate shocks, where all other economic variables are held constant. Operating entities are required to monitor EVE sensitivities as a percentage of capital resources.
Non-trading Value at Risk
Non-trading portfolios comprise positions that primarily arise from the interest rate management of our retail and commercial banking assets and liabilities, financial investments measured at FVOCI, debt instruments measured at amortised cost, and exposures arising from our insurance operations.
The following table summarises the main business areas where non-trading market risks reside, and the market risk measures used to monitor and limit exposures.
| Non-trading risk |
||
| • Interest rates • Credit spreads
|
||
| Value at risk | Sensitivity | Stress testing |
||
Non-trading portfolios
Value at risk of the non-trading portfolios
(Audited)
Non-trading VaR includes the interest rate risk in the banking book transferred to and managed by Markets Treasury and the exposures generated by the portfolio of HQLA held by Markets Treasury to meet liquidity requirements.
The non-trading VaR reduced materially during 2022 from £29.4m to end the year at £18.6m and was predominately driven by interest rate risk. The volatile market conditions driven by geopolitical events and concerns around high inflation led the Markets Treasury business to materially reduce the holdings of outright and asset swapped UK and US Government bonds. The rationale for the execution was to firstly protect the value of the Held to Collect and Sale portfolio and secondly to reduce the entities sensitivity to the increase of interest rates. There was a spike in the VaR during September due to a recalibration of the VaR model to incorporate the market volatility, however the Markets Treasury business took further action to reduce their Interest Rate sensitivity following change in the UK fiscal stance and increase in uncertainty leading the bond market to sell off sharply and bond yields rise to multi year highs. The daily levels of total non-trading VaR over the last year are set out in the graph below.
| Daily VaR (non-trading portfolios), 99% 1 day (£m) |
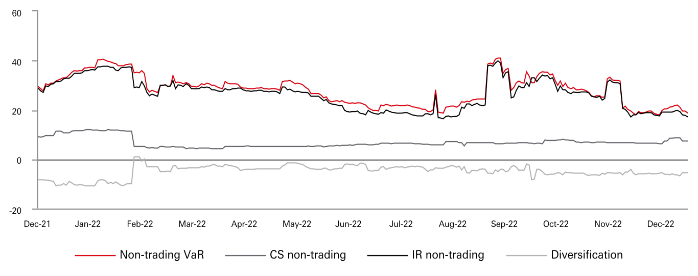
The group's non-trading VaR for the year is shown in the table below.
| Non-trading VaR, 99% 1 day |
||||
| (Audited) |
||||
|
|
Interest |
Credit |
Portfolio |
Total2 |
|
|
£m |
£m |
£m |
£m |
| Balance at 31 Dec 2022 |
17.1 |
7.2 |
(5.6) |
18.6 |
| Average |
26.3 |
6.7 |
(5.0) |
28.0 |
| Maximum |
39.7 |
11.9 |
- |
40.9 |
| Minimum |
16.3 |
4.2 |
- |
17.8 |
|
|
|
|
|
|
| Balance at 31 Dec 2021 |
28.7 |
9.0 |
(8.4) |
29.4 |
| Average |
26.6 |
10.0 |
(5.6) |
31.0 |
| Maximum |
34.6 |
12.7 |
- |
37.8 |
| Minimum |
18.0 |
7.2 |
- |
22.5 |
1 Portfolio diversification is the market risk dispersion effect of holding a portfolio containing different risk types. It represents the reduction in unsystematic market risk that occurs when combining a number of different risk types, for example, interest rate, equity and foreign exchange, together in one portfolio. It is measured as the difference between the sum of the VaR by individual risk type and the combined total VaR. A negative number represents the benefit of portfolio diversification. As the maximum occurs on different days for different risk types, it is not meaningful to calculate a portfolio diversification benefit for this measure.
2 The total VaR is non-additive across risk types due to diversification effect.
Other Risk
Non-trading book foreign exchange exposures are outlined below.
Structural foreign exchange exposures
Structural foreign exchange exposures represent net assets or capital investments in subsidiaries, branches, joint arrangement or associates, together with any associated hedges, the functional currencies of which are currencies other than pound sterling.
An entity's functional currency is that of the primary economic environment in which the entity operates. We use the pound sterling as our presentation currency in our consolidated financial statements because sterling forms the major currency in which we transact and fund our business. Exchange rate differences on structural exposures are recognised in other comprehensive income ('OCI').
The structural foreign exchange exposures are managed within limits such that the capital ratios and the capital ratios of individual banking subsidiaries are largely protected from the effect of changes in exchange rates. We may hedge certain structural foreign exchange positions, either at entity level, or by relying on hedges held in other group entities, subject to approved limits.
Transaction foreign exchange exposures
Transactional foreign exchange risk arises primarily from day-to-day transactions in the banking book generating profit and loss or FVOCI reserves in a currency other than the reporting currency of the operating entity. Transactional foreign exchange exposure generated through profit and loss is periodically transferred to Markets and Securities Services and managed within limits with the exception of limited residual foreign exchange exposure arising from timing differences or for other reasons. Transactional foreign exchange exposure generated through OCI reserves is managed by the Markets Treasury business within agreed appetite.
Pension risk management processes
HSBC provides future pension benefits on a defined contribution basis from many of its European operations. However, there remain future defined benefit pensions provided in the region.
Pension plans are run by local fiduciaries in line with local legislative requirements. The largest pension plan is the HSBC Trinkaus & Burkhardt Pension Scheme which is regulated by the German Company Benefits Act (Gesetz zur Verbesserung der betrieblichen Altersversorgung - Betriebsrentengesetz - BetrAVG).
In defined contribution pension plans, the contributions that HSBC is required to make are known, while the ultimate pension benefit will vary, typically with investment returns achieved by investment choices made by the employee.
While the market risk to HSBC of defined contribution plans is low, it is still exposed to operational and reputational risk.
In defined benefit pension plans, the level of pension benefit is known. Therefore, the level of contributions required by HSBC will vary due to a number of risks, including:
• investments delivering a return below that required to provide the projected plan benefits;
• the prevailing economic environment leading to corporate failures, thus triggering write-downs in asset values (both equity and debt);
• a change in either interest rates or inflation, causing an increase in the value of the plan liabilities; and
• plan members living longer than expected (known as
longevity risk).
Pension risk is assessed using an economic capital model that takes into account potential variations in these factors.
The impact of these variations on both pension assets and pension liabilities is assessed using a one-in-200-year stress test. Scenario analysis and other stress tests are also used to support pension risk management.
To fund the benefits associated with defined benefit plans, sponsoring group companies, and in some instances employees, make regular contributions in accordance with advice from actuaries and in consultation with the plan's fiduciaries where relevant. These contributions are normally set to ensure that there are sufficient funds to meet the cost of the accruing benefits for the future service of active members. However, higher contributions are required when plan assets are considered insufficient to cover the existing pension liabilities. Contribution rates are typically revised annually or once every three years, depending on the plan.
The defined benefit plans invest contributions in a range of investments designed to limit the risk of assets failing to meet a plan's liabilities. Any changes in expected returns from the investments may also change future contribution requirements. In pursuit of these long-term objectives, an overall target allocation of the defined benefit plan assets between asset classes is established. In addition, each permitted asset class has its own benchmarks, such as stock market or property valuation indices or liability characteristics. The benchmarks are reviewed at least once every three to five years and more frequently if required by local legislation or circumstances. The process generally involves an extensive asset and liability review.
Capital risk in 2022
Capital overview
| Capital adequacy metrics |
||
|
|
At |
|
|
|
31 Dec |
31 Dec |
|
|
2022 |
2021 |
| Risk-weighted assets ('RWAs') (£m) |
|
|
| Credit risk |
68,821 |
69,929 |
| Counterparty credit risk |
17,981 |
16,434 |
| Market risk |
15,822 |
9,828 |
| Operational risk |
11,547 |
10,512 |
| Total RWAs |
114,171 |
106,703 |
| Capital on a transitional basis (£m) |
|
|
| Common equity tier 1 ('CET1') capital |
19,184 |
18,963 |
| Tier 1 capital |
23,077 |
22,825 |
| Total capital |
36,187 |
33,992 |
| Capital ratios on a transitional basis (%) |
|
|
| Common equity tier 1 |
16.8 |
17.8 |
| Total tier 1 |
20.2 |
21.4 |
| Total capital ratio |
31.7 |
31.9 |
| Leverage ratio (transitional) 2 |
|
|
| Tier 1 capital (£m) |
23,077 |
22,825 |
| Total leverage ratio exposure measure (£m) |
417,587 |
536,518 |
| Leverage ratio (%) |
5.5 |
4.3 |
| Leverage ratio (fully phased-in) 2 |
|
|
| Tier 1 capital (£m) |
23,077 |
22,652 |
| Total leverage ratio exposure measure (£m) |
417,587 |
536,518 |
| Leverage ratio (%) |
5.5 |
4.2 |
References to EU regulations and directives (including technical standards) should, as applicable, be read as references to the UK's version of such regulation and/or directive, as onshored into UK
law under the European Union (Withdrawal) Act 2018, and as may be subsequently amended under UK law.
Capital figures and ratios in the table above are calculated in accordance with the revised Capital Requirements Regulation and Directive, as implemented ('CRR II'). Leverage ratios are calculated using the end point definition of capital and the IFRS 9 regulatory transitional arrangements.
Regulatory transitional arrangements for IFRS 9 'Financial Instruments'
We have adopted the regulatory transitional arrangements in
CRR II for IFRS 9, including paragraph four of article 473a. Our capital and ratios are presented under these arrangements throughout the table above. Without their application, our CET1 ratio would be 16.8%.
The IFRS 9 regulatory transitional arrangements allow banks to add back to their capital base a proportion of the impact that IFRS 9 has upon their loan loss allowances during the first five years of use. The impact is defined as:
• the increase in loan loss allowances on day one of IFRS 9 adoption; and
• any subsequent increase in expected credit losses ('ECL') in the non-credit-impaired book thereafter.
Any add-back must be tax-effected and accompanied by a recalculation of exposure and RWAs. The impact is calculated separately for portfolios using the standardised ('STD') and internal ratings based ('IRB') approaches. For IRB portfolios, there is no add-back to capital unless loan loss allowances exceed regulatory 12-month expected losses.
In the current period, the add-back to the capital base amounted to £24m under the STD approach with tax impacts of £5m which resulted in a net add-back of £19m.
Own funds
| Own funds disclosure |
|||
| (Audited) |
|
||
|
|
|
At |
|
|
|
|
31 Dec |
31 Dec |
|
|
|
2022 |
2021 |
| Ref* |
|
£m |
£m |
|
|
Common equity tier 1 ('CET1') capital: instruments and reserves |
|
|
| 1 |
Capital instruments and the related share premium accounts |
1,217 |
797 |
|
|
- ordinary shares |
1,217 |
797 |
| 2 |
Retained earnings1,2 |
16,177 |
15,511 |
| 3 |
Accumulated other comprehensive income (and other reserves)1,2 |
4,010 |
2,931 |
| 5 |
Minority interests (amount allowed in consolidated CET1) |
72 |
57 |
| 5a |
Independently reviewed interim net profits net of any foreseeable charge or dividend3 |
(1,459) |
625 |
| 6 |
Common equity tier 1 capital before regulatory adjustments2 |
20,017 |
19,921 |
| 28 |
Total regulatory adjustments to common equity tier 1 |
(833) |
(958) |
| 29 |
Common equity tier 1 capital2 |
19,184 |
18,963 |
| 36 |
Additional tier 1 capital before regulatory adjustments |
3,942 |
3,906 |
| 43 |
Total regulatory adjustments to additional tier 1 capital |
(49) |
(44) |
| 44 |
Additional tier 1 capital |
3,893 |
3,862 |
| 45 |
Tier 1 capital2 |
23,077 |
22,825 |
| 51 |
Tier 2 capital before regulatory adjustments |
13,559 |
11,591 |
| 57 |
Total regulatory adjustments to tier 2 capital |
(449) |
(424) |
| 58 |
Tier 2 capital |
13,110 |
11,167 |
| 59 |
Total capital2 |
36,187 |
33,992 |
* The references identify the lines prescribed in the European Banking Authority template, which are applicable and where there is a value.
1 These disclosures are based on updated rules implemented from 1 January 2022 including the PRA's disclosure templates and instructions which came into force at that time. The presentation of comparatives has been amended only for CRR II grandfathered instruments to align to the updated template's rows and instructions.
2 From 30 September 2022, investments in non-financial institution subsidiaries or participations have been measured on an equity accounting basis in compliance with UK regulatory requirements. Comparatives for prior periods have been represented on a consistent basis with the current year.
3 This row includes losses that have been recognised and deducted as they arose and were therefore not subject to an independent review.
At 31 December 2022, our common equity tier 1 ('CET1') capital ratio decreased to 16.8% from 17.8% at 31 December 2021. The key drivers of the fall in our CET1 ratio were:
• a 1.6 percentage point impact from the expected loss on reclassification of our retail banking operations in France to held for sale;
• a 1.2 percentage point impact from RWA growth due to implementation of new regulations and increased volatility in the market and due to impact of FX movement
Share issuance, profits and other movements added 1.8 percentage points to the CET1 ratio.
Throughout 2022, we complied with the PRA's regulatory capital adequacy requirements, including those relating to stress testing.
Risk-weighted assets
| RWA movement by key driver |
|
|
|
|
|
|
Total |
|
|
£m |
| RWAs at 1 Jan 2022 |
106,703 |
| Asset size |
3,531 |
| Asset quality |
296 |
| Model updates |
(2,804) |
| Methodology and policy |
(937) |
| Foreign exchange movement |
7,382 |
| Total RWA movement |
7,468 |
| RWAs at 31 Dec 2022 |
114,171 |
RWAs increased by £7.5bn during the year, including an increase of £7.4bn due to foreign currency translation differences.
Asset size
Asset size increased by £3.5bn driven by an increase in Market Risk RWA by £4.5bn mainly attributable to heightened market risk volatility, and an increase in transactional and structural foreign exchange exposure. This was partially offset by £0.7bn decrease in Credit Risk RWAs due to other balance sheet movements.
Asset quality
Credit Risk increased marginally by £0.3bn due to portfolio mix changes.
Model updates
The £2.8bn decrease in RWAs was mainly driven by the implementation of new models for retail credit risk and equity prices (in market risk).
Methodology and policy
The £0.9bn decrease in RWA is mainly driven by synthetic securitization and by risk parameter refinements, partially offset by increases due to implementation of CRR II rules.
Leverage ratio
Our leverage ratio is 5.5% at 31 December 2022, up from 4.2% at 31 December 2021. The improvement was primarily due to the exclusion of central bank claims and cash pooling netting following the implementation of the PRA UK leverage ratio framework from 1 January 2022 and a rise in tier 1 capital.
Pillar 3 disclosure requirements
Pillar 3 of the Basel regulatory framework is related to market discipline and aims to make financial services firms more transparent by requiring publication of wide-ranging information on their risks, capital and management. Our Pillar 3 Disclosures at 31 December 2022 is published on our website, www.hsbc.com/investors.
Structural foreign exchange exposures
The group's structural foreign currency exposure is represented by the net assets or capital investments in subsidiaries, branches, joint arrangements or associates, the functional currencies of which are currencies other than the sterling.
For our policies and procedures for managing structural foreign exchange exposures, see page 79 of the 'Risk management' section.
| Net structural foreign exchange exposures |
||
|
|
2022 |
2021 |
|
|
£m |
£m |
| Currency of structural exposure |
|
|
| Euro |
10,007 |
8,068 |
| US Dollars |
1,062 |
1,470 |
| South African Rand |
287 |
285 |
| Israeli New Shekel |
85 |
169 |
| Others, each less than £150m |
305 |
319 |
| At 31 Dec |
11,746 |
10,311 |
Liquidity and funding risk in 2022
Liquidity coverage ratio
The LCR aims to ensure that a bank has sufficient unencumbered HQLA to meet its liquidity needs in a 30-calendar-day liquidity stress scenario. HQLA consist of cash or assets that can be converted into cash at little or no loss of value in markets.
At 31 December 2022, all the group's principal operating entities were within the LCR risk tolerance level established by the Board and applicable under the LFRF.
The following table displays the individual LCR levels for HSBC Bank plc's principal operating entities on the European Commission Delegated Regulation basis.
| Operating entities' LCRs1,2,3 |
|||
|
|
|
At |
|
|
|
|
31 Dec |
31 Dec |
|
|
|
2022 |
2021 |
|
|
|
% |
% |
| HSBC Bank plc |
|
143 |
142 |
| HSBC Continental Europe |
|
150 |
142 |
In addition to the regulatory metric, the group manages liquidity via 'internal liquidity metric', which is being used to monitor and manage liquidity risk via a low-point measure across a 270-day horizon, taking into account recovery capacity.
Net stable funding ratio
The Net Stable Funding Ratio ('NSFR') requires institutions to maintain sufficient stable funding relative to required stable funding, and reflects a bank's long-term funding profile (funding with a term of more than a year).
At 31 December 2022, all the group's principal operating entities were within the NSFR risk tolerance level established by the Board and applicable under the LFRF.
Operating entities' NSFRs1,2 |
|||
|
|
|
At |
|
|
|
|
31 Dec |
31 Dec |
|
|
|
2022 |
2021 |
|
|
|
% |
% |
| HSBC Bank plc |
|
115 |
115 |
| HSBC Continental Europe |
|
140 |
130 |
Depositor concentration and term funding maturity concentration
The LCR and NSFR metrics assume a stressed outflow based on a portfolio of depositors within each depositor segment. To ensure the validity of these assumptions in the sense that the deposit base is sufficient diversified, the depositor concentration is monitored on an ongoing basis.
In addition to this, operating entities monitor the term funding maturity concentration metric to ensure they are not overly exposed to term funding concentration of wholesale market counterparts by the current maturity profile in any defined period.
Liquid assets of the group's principal operating entities
The table below shows the unweighted liquidity value of assets categorised as liquid, which is used for the purposes of calculating the LCR metric. This reflects the stock of unencumbered liquid assets at the reporting date, using the regulatory definition of liquid assets.
| Operating entities' liquid assets1,2,3 |
|
|
|
|
At Estimated liquidity value |
At Estimated liquidity value |
|
|
31 Dec 2022 |
31 Dec 2021 |
|
|
£m |
£m |
| HSBC Bank plc |
|
|
| Level 1 |
93,500 |
88,423 |
| Level 2a |
5,726 |
3,195 |
| Level 2b |
3,270 |
3,473 |
| HSBC Continental Europe |
|
|
| Level 1 |
74,852 |
39,159 |
| Level 2a |
781 |
450 |
| Level 2b |
173 |
142 |
|
|
|
|
1 The LCR and NSFR ratios presented in this table are based on average value. The LCR is the average of the preceding 12 months. The NSFR is the average of preceding quarters. Prior period numbers have been restated for consistency.
2 In response to the requirement for an IPU in line with EU Capital Requirements Directive ('CRD V'), HBCE completed the change of control transactions for HSBC Germany ('HTDE') and HSBC Malta ('HBMT') on 30 November 2022. The average for LCR and NSFR includes the impact of inclusion of two entities for Nov-22 and Dec-22.
3 In December 2022, a strategic data enhancement was implemented which resulted in a reclassification of some securities. This reclassification drove a reduction in total High Quality Liquid Assets and corresponding LCR as of 31 December 2022. Prior period numbers have been restated for consistency.
Sources of funding
Our primary sources of funding are customer current accounts, repo and wholesale securities.
The following 'Funding sources and uses' table provides a consolidated view of how our balance sheet is funded, and should be read in light of the LFRF, which requires operating entities to manage liquidity and funding risk on a stand-alone basis.
The table analyses our consolidated balance sheet according to the assets that primarily arise from operating activities and the
sources of funding primarily supporting these activities. Assets and liabilities that do not arise from operating activities are presented at other balance sheet lines. In 2022, the level of customer accounts continued to exceed the level of loans and advances to customers. The positive funding gap was predominantly deployed in liquid assets, cash and balances with central banks and financial investments, as required by the LFRF.
| Funding sources and uses for the group |
||||||
|
|
2022 |
2021 |
|
|
2022 |
2021 |
|
|
£m |
£m |
|
|
£m |
£m |
| Sources |
|
|
|
Uses |
|
|
| Customer accounts |
215,948 |
205,241 |
|
Loans and advances to customers |
72,614 |
91,177 |
| Deposits by banks |
20,836 |
32,188 |
|
Loans and advances to banks |
17,109 |
10,784 |
| Repurchase agreements - non-trading |
32,901 |
27,259 |
|
Reverse repurchase agreements - non-trading |
53,949 |
54,448 |
| Debt securities in issue |
7,268 |
9,428 |
|
Cash collateral, margin and settlement accounts |
51,858 |
34,907 |
| Cash collateral, margin and settlement accounts |
60,385 |
37,076 |
|
Assets held for sale |
21,214 |
9 |
| Liabilities of disposal groups held for sale |
24,711 |
- |
|
Trading assets |
79,878 |
83,706 |
| Subordinated liabilities |
14,528 |
12,488 |
|
- reverse repos |
8,729 |
8,626 |
| Financial liabilities designated at fair value |
27,287 |
33,608 |
|
- stock borrowing |
5,627 |
6,498 |
| Liabilities under insurance contracts |
19,987 |
22,264 |
|
- other trading assets |
65,522 |
71,862 |
| Trading liabilities |
41,265 |
46,433 |
|
Financial investments |
32,604 |
41,300 |
| - repos |
8,213 |
7,663 |
|
Cash and balances with central banks |
131,433 |
108,482 |
| - stock lending |
1,773 |
1,637 |
|
Other balance sheet assets |
256,694 |
171,798 |
| - other trading liabilities |
31,279 |
37,133 |
|
At 31 Dec |
717,353 |
596,611 |
| Total equity |
24,016 |
23,715 |
|
|
|
|
| Other balance sheet liabilities |
228,221 |
146,911 |
|
|
|
|
| At 31 Dec |
717,353 |
596,611 |
|
|
|
|
Contingent liquidity risk arising from committed lending facilities
The group provides customers with committed facilities such as standby facilities to corporate customers and committed backstop lines to conduits sponsored by the group. All of the undrawn commitments provided to conduits or external customers are accounted for in the LCR and NSFR in line with the applicable regulations.
This ensures that under a stress scenario any additional outflow generated by increased utilisation of these committed facilities by either customers or the group's sponsored conduits is appropriately reflected in our liquidity and funding position.
In relation to commitments to customers, the table below shows the level of undrawn commitments outstanding in terms of the five largest single facilities and the largest market sector.
| The group's contractual exposures at 31 December monitored under the contingent liquidity risk limit structure |
||
|
|
2022 |
2021 |
|
|
£bn |
£bn |
| Commitments to conduits |
|
|
| Multi-seller conduits1 |
|
|
| - total lines |
3.7 |
4.2 |
| - largest individual lines |
0.2 |
0.2 |
| Securities investment conduits - total lines |
1.3 |
1.3 |
| Commitments to customers |
|
|
| - five largest 2 |
3.7 |
10.4 |
| - largest market sector3 |
13.3 |
7.7 |
1 Exposures relate to the Regency multi-seller conduit. This vehicle provides funding to group customers by issuing debt secured by a diversified pool of customer-originated assets.
2 Represents the undrawn balance for the five largest committed liquidity facilities provided to customers, other than those facilities to conduits.
3 Represents the undrawn balance for the total of all committed liquidity facilities provided to the largest market sector, other than those facilities to conduits.
Asset encumbrance and collateral management
An asset is defined as encumbered if it has been pledged as collateral against an existing liability and, as a result, is no longer available to the group to secure funding, satisfy collateral needs or be sold to reduce the funding requirement. Collateral is managed on an operating entity basis consistent with the approach to managing liquidity and funding. Available collateral held in an operating entity is managed as a single consistent collateral pool
from which each operating entity will seek to optimise the use of the available collateral. The objective of this disclosure is to facilitate an understanding of available and unrestricted assets that could be used to support potential future funding and collateral needs. The disclosure is not designed to identify assets which would be available to meet the claims of creditors or to predict assets that would be available to creditors in the event of a resolution or bankruptcy.
| Summary of assets available to support potential future funding and collateral needs (on- and off-balance sheet) |
||
|
|
2022 |
2021 |
|
|
£m |
£m |
| Total on-balance sheet assets at 31 Dec |
717,353 |
596,611 |
| Less: |
|
|
| - reverse repo/stock borrowing receivables and derivative assets |
(293,543) |
(207,513) |
| - other assets that cannot be pledged as collateral |
(51,974) |
(48,350) |
| Total on-balance sheet assets that can support funding and collateral needs at 31 Dec |
371,836 |
340,748 |
| Add: off-balance sheet assets |
|
|
| - fair value of collateral received in relation to reverse repo/stock borrowing/derivatives that is available to sell or repledge |
180,233 |
202,794 |
| Total assets that can support future funding and collateral needs |
552,069 |
543,542 |
| Less: |
|
|
| - on-balance sheet assets pledged |
(98,124) |
(93,513) |
| - re-pledging of off-balance sheet collateral received in relation to reverse repo/stock borrowing/derivatives |
(136,777) |
(151,378) |
| Assets available to support funding and collateral needs at 31 Dec |
317,168 |
298,651 |
| Market risk |
Overview
Market risk is the risk that movements in market factors, including foreign exchange rates and commodity prices, interest rates, credit spreads and equity prices will reduce the group's income or the value of its portfolios.
Exposure to market risk is separated into two portfolios.
Trading portfolios comprise positions arising from market-making and warehousing of customer-derived positions.
Non-trading portfolios including Markets Treasury comprise positions that primarily arise from the interest rate management of the group's retail and commercial banking assets and liabilities, financial investments designated as held-to-collect-and-sale ('HTCS'), and exposures arising from the group's insurance operations.
Key developments in 2022
There were no material changes to our policies and practices for the management of market risk in 2022.
Market risk governance
(Audited)
The following diagram summarises the main business areas where trading market risks reside, and the market risk measures used to monitor and limit exposures.
| Trading risk |
|
| • Foreign exchange and commodities • Interest rates • Credit spreads • Equities |
|
| Value at risk | Sensitivity | Stress testing |
Where appropriate, we apply similar risk management policies and measurement techniques to trading portfolios. Our objective is to manage and control market risk exposures to optimise return on risk while maintaining a market profile consistent with our established risk appetite.
Market risk is managed and controlled through limits approved by the group Chief Risk Officer. These limits are allocated across business lines and to the group and its subsidiaries. The majority of HSBC's total VaR and almost all trading VaR reside in GBM. Each major operating entity has an independent market risk management and control sub-function, which is responsible for measuring, monitoring and reporting market risk exposures against limits on a daily basis. The Traded Risk function enforces the controls around trading in permissible instruments approved for each site as well as following completion of the new product approval process. Traded Risk also restricts trading in the more complex derivative products to offices with appropriate levels of product expertise and robust control systems.
Market risk measures
Monitoring and limiting market risk exposures
Our objective is to manage and control market risk exposures while maintaining a market profile consistent with the group's risk appetite.
We use a range of tools to monitor and limit market risk exposures including sensitivity analysis, VaR, and stress testing
Sensitivity analysis
Sensitivity analysis measures the impact of individual market factor movements on specific instruments or portfolios, including interest rates, foreign exchange rates, credit spreads and equity prices, such as the effect of a one basis point change in yield. We use sensitivity measures to monitor the market risk positions within each risk type. Sensitivity limits are set for portfolios, products and risk types, with the depth of the market being one of the principal factors in determining the level of limits set.
Value at risk
VaR is a technique that estimates the potential losses on risk positions as a result of movements in market rates and prices over a specified time horizon and to a given level of confidence. The use of VaR is integrated into market risk management and is calculated for all trading positions regardless of how the group capitalises those exposures. Where there is not an approved internal model, the group uses the appropriate local rules to capitalise exposures.
The VaR model for trading portfolios are predominantly based on historical simulation. The VaR is calculated at a 99% confidence level for a one-day holding period. Where we do not calculate VaR explicitly, we use alternative tools like Stress Testing.
The VaR models derive plausible future scenarios from past series of recorded market rates and prices, taking into account inter-relationships between different markets and rates such as interest rates and foreign exchange rates. The models also incorporate the effect of option features on the underlying exposures.
The historical simulation models used incorporates the following features:
• Historical market rates and prices are calculated with reference to foreign exchange rates and commodity prices, interest rates, equity prices and the associated volatilities;
• Potential market movements utilised for VaR are calculated with reference to data from the past two years; and
• VaR measures are calculated to a 99% confidence level and use a one-day holding period.
The nature of the VaR models means that an increase in observed market volatility will most likely lead to an increase in VaR without any changes in the underlying positions.
VaR model limitations
Although a valuable guide to risk, VaR should always be viewed in the context of its limitations. For example:
• the use of historical data as a proxy for estimating future events may not encompass all potential events, particularly those which are extreme in nature;
• the use of a holding period assumes that all positions can be liquidated or the risks offset during that period. This may not fully reflect the market risk arising at times of severe illiquidity, when the holding period may be insufficient to liquidate or hedge all positions fully;
• the use of a 99% confidence level by definition does not take into account losses that might occur beyond this level of confidence; and
• VaR is calculated on the basis of exposures outstanding at the close of business and therefore does not necessarily reflect intra-day exposures.
Risk not in VaR framework
Other basis risks which are not completely covered in VaR are complemented by our risk not in VaR ('RNIV') calculations, and are integrated into our capital framework.
Risk factors are reviewed on a regular basis and either incorporated directly in the VaR models, where possible, or quantified through the VaR-based RNIV approach or a stress test approach within the RNIV framework. The outcome of the VaR-based RNIV is included in the VaR calculation; a stressed VaR RNIV is also computed for the risk factors considered in the VaR-based RNIV approach.
Stress-type RNIVs include a deal contingent derivatives capital charge to capture risk for these transactions and a de-peg risk measure to capture risk to pegged and heavily managed currencies.
Stress testing
Stress testing is an important procedure that is integrated into our market risk management tool to evaluate the potential impact on portfolio values of more extreme, although plausible, events or movements in a set of financial variables. In such scenarios, losses can be much greater than those predicted by VaR modelling.
Stress testing is implemented at legal entity, regional and overall Group levels. A standard set of scenarios is utilised consistently across all regions within the HSBC Group. Scenarios are tailored to capture the relevant events or market movements at each level. The risk appetite around potential stress losses for the group is set and monitored against referral limits.
Market risk reverse stress tests are undertaken on the premise that there is a fixed loss. The stress testing process identifies which scenarios lead to this loss. The rationale behind the reverse stress test is to understand scenarios which are beyond normal business settings that could have contagion and systemic implications.
Stressed VaR and stress testing, together with reverse stress testing and the management of gap risk, provide management with insights regarding the 'tail risk' beyond VaR for which the group's appetite is limited.
Trading portfolios
Back-testing
We routinely validate the accuracy of our VaR models by back-testing the VaR metric against both actual and hypothetical profit and loss. Hypothetical profit and loss excludes non-modelled items such as fees, commissions and revenue of intra-day transactions.
The hypothetical profit and loss reflects the profit and loss that would be realised if positions were held constant from the end of one trading day to the end of the next. This measure of profit and loss does not align with how risk is dynamically hedged, and is not therefore necessarily indicative of the actual performance of the business.
The number of back-testing exceptions is used to gauge how well the models are performing. We consider enhanced internal monitoring of a VaR model if more than five profit exceptions or more than five loss exceptions occur in a 250-day period.
We back-test our VaR at set levels of our group entity hierarchy.
Defined benefit pension plans
Market risk also arises within the Bank's defined benefit pension plans to the extent that the obligations of the plans are not fully matched by assets with determinable cash flows. Refer to the Pension risk management processes section on page 79 for additional information.
Market risk in 2022
The volatility in financial markets was elevated in 2022 driven by high inflation and the geopolitical risk around Ukraine. During the first half of the year, Russia-Ukraine war led supply chain disruptions increasing energy and food prices. The Zero-Covid policy in China added to the supply chain disruptions. Central Banks around the world (both from Developed and Emerging markets) aggressively started raising policy rates to tame the surging inflation. The US and Europe imposed multiple sanctions on Russia leading to large sell off of the Russian assets. The global equity markets sold off and IPO dried off. The fixed income prices fell responding to increasing rates. The USD index rallied with JPY, EUR and GBP depreciating. The Credit market sold off with new issuances drying up. European markets also underperformed as Russia retaliated by cutting of gas supply to Europe. US and European governments aggressively intervened in the energy market by releasing Oil from strategic reserve driving Oil prices down. Supply chain disruption also eased leading to Inflation coming down in second half of 2022. However, volatility in financial markets remained elevated particularly in the UK as the cost of living crisis intensified. In addition, a change in the UK fiscal stance in late September 2022 led to the pound sterling reaching record lows and to significant turmoil in the market for long-dated UK government bonds, which was exacerbated by rapid deleveraging of liability-driven investment funds used by pension schemes.
Trading portfolios
Value at risk of the trading portfolios
(Audited)
The Trading VaR predominantly resides within Market Securities Services where it was £31.2m as at 31 December 2022, compared with £19m at 31 December 2021. The Total Trading VaR peaked at £60m in September owing to the sensitivity of the trading book to interest rate moves, coupled with a large volatility in the rates market. When the central banks started to intervene beginning of Q4, the market volatility started to ease; as a result, the Trading VaR decreased and remained fairly stable over the last three months of the year, ranging between £31.2m and £38.15m.
| Daily VaR (trading portfolios), 99% 1 day (£m) |
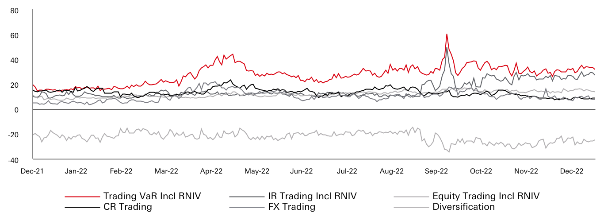
The group's trading VaR for the year is shown in the table below.
| Trading VaR, 99% 1 day |
||||||
| (Audited) |
||||||
|
|
Foreign |
Interest |
Equity ('EQ') |
Credit |
Portfolio Diversification1 |
Total2 |
|
|
£m |
£m |
£m |
£m |
£m |
£m |
| Balance at 31 Dec 2022 |
7.5 |
26.4 |
13.6 |
8.6 |
(24.9) |
31.2 |
| Average |
10.0 |
15.3 |
11.7 |
13.0 |
(22.8) |
27.2 |
| Maximum |
21.5 |
49.2 |
17.1 |
22.9 |
- |
60.0 |
| Minimum |
3.3 |
8.2 |
6.8 |
7.0 |
- |
14.2 |
|
|
||||||
| Balance at 31 Dec 2021 |
4.5 |
10.0 |
10.5 |
14.9 |
(20.9) |
19.0 |
| Average |
7.1 |
12.8 |
10.2 |
12.6 |
(20.4) |
22.3 |
| Maximum |
19.3 |
26.7 |
14.9 |
16.7 |
- |
31.9 |
| Minimum |
3.7 |
9.3 |
6.3 |
9.2 |
- |
17.3 |
1 Portfolio diversification is the market risk dispersion effect of holding a portfolio containing different risk types. It represents the reduction in unsystematic market risk that occurs when combining a number of different risk types, for example, interest rate, equity and foreign exchange, together in one portfolio. It is measured as the difference between the sum of the VaR by individual risk type and the combined total VaR. A negative number represents the benefit of portfolio diversification. As the maximum occurs on different days for different risk types, it is not meaningful to calculate a portfolio diversification benefit for this measure.
2 The total VaR is non-additive across risk types due to diversification effect and it includes VaR RNIV.
Back-testing
HSBC Bank plc experienced 11 back testing exceptions against the Hypothetical P&L and 9 back testing exceptions against the Actual P&L. The hypothetical back testing exceptions were driven by losses from defensive positioning in rates, equity, credit and FX exposures on days when markets rallied.
In addition, there were two actual back testing exceptions driven by one off changes in reserves (such as month end adjustment) and two actual back testing exceptions driven by losses from the unwinding of a large trade.
| Climate Risk |
Overview
Climate risks have the potential to cause both financial and non-financial impacts for HSBC Bank plc. Financial impacts could materialise, for example, through greater transactional losses and/or increased capital requirements. Non-financial impacts could materialise if our own assets or operations are impacted by extreme weather or chronic changes in weather patterns, or as a result of business decisions to help achieve the HSBC Group's climate ambition.
We remain aligned to the HSBC Group climate ambition to align HSBC Group's own operations and supply chain to net zero by 2030, and the financed emissions from the HSBC Group's portfolio of customers to net zero by 2050. The HSBC Group announced in March 2022 that it intends to publish a climate transition plan in 2023, and committed to a science-aligned phase-down of fossil fuel finance, and a review of its wider financing and investment policies critical to achieving net zero by 2050. This follows the HSBC Group's thermal coal phase out policy, which was announced in 2021.
Key developments in 2022
• HSBC Bank plc's risk appetite statement is approved by the Board and includes the measures we intend to take to enable the delivery of our climate ambition and meet our commitments.
• Through our dedicated climate risk programme, we have continued to embed climate considerations throughout the firm, including updating the scope of our programme to cover all risk types, expanding the scope of climate related training and developing new climate risk metrics to monitor and manage exposures as well as publishing a new greenwashing risk management framework.
• We have enhanced and expanded the use of a client Transition Engagement Questionnaire to better understand our exposure to the highest transition risk sectors and we continue to engage with our customers to understand and support their transition away from high carbon activities.
Governance and structure
The group's Board takes overall responsibility for our ESG strategy, overseeing executive management in developing the approach, execution and associated reporting.
We continue to aim to deepen our understanding of the drivers of climate risk as well as aim to manage our exposure. A dedicated Climate Risk Oversight Forum is responsible for shaping and overseeing our approach and providing support in managing climate risk.
The group's Risk Management Meeting and Risk Committee receive regular updates on our climate risk profile and progress of our climate risk programme.
Key risk management processes
We are integrating climate risk into the policies, processes and controls across many areas of our organisation, and we will continue to update these as our climate risk management capabilities mature over time. We continue to enhance our climate risk scoring tool, which will enable us to assess our customers' exposures to climate risk.
| Resilience Risk |
Overview
Resilience risk is the risk that we are unable to provide critical services to our customers, affiliates and counterparties as a result of sustained and significant operational disruption. Resilience risk arises from failures or inadequacies in processes, people, systems or external events.
Key developments in 2022
The Operational and Resilience Risk sub-function seeks to provide robust Risk Steward oversight of the management of risk by our businesses, functions and legal entities. This includes effective and timely independent challenge and expert advice. During the year, we carried out a number of initiatives to seek to keep pace with geopolitical, regulatory and technology changes and to strengthen the management of resilience risk:
• We focus on understanding of our risk and control environment, by updating our risk taxonomy and control libraries, and refreshing risk and control assessments.
• We implemented heightened monitoring and reporting of cyber, third party, business continuity and payment/sanctions risks resulting from the Russia-Ukraine war and enhanced controls and key processes where needed.
• We provide analysis and reporting of non-financial risks providing easy to access risk and control information and metrics that enable management to focus on non-financial risks in their decision-making and appetite setting.
• We aimed to further strengthen our non-financial risk governance and senior leadership and improved our coverage and Risk Steward oversight, for data privacy and change execution.
Governance and structure
The Operational and Resilience Risk target operating model provides a globally consistent approach, which allows us to define a group view across resilience risks, strengthening our risk management oversight while operating effectively as part of a simplified non-financial risk structure. We view resilience risk across nine sub-risk types related to: failure to manage third parties; technology and cybersecurity; transaction processing; failure to protect people and places from physical malevolent acts; business interruption and incident risk; data risk; change execution risk; building unavailability; and workplace safety.
Risk appetite and key escalations for resilience risk are reported to our Risk Management Meeting (chaired by the HSBC Bank plc Chief Risk Officer) and to our Risk Committee.
Key risk management process
Operational resilience is our ability to anticipate, prevent, adapt, respond to, recover and learn from operational disruption while minimising customer and market impact. Resilience is determined by assessing whether we are able to continue to provide our most important services, within an agreed level. This is achieved via day-to-day oversight, periodic and ongoing assurance, such as deep dive review and controls testing, which may result in challenges being raised to the business by Risk Stewards. Further challenge is also raised in the form of quarterly Risk Steward opinion papers to formal governance. We accept we will not be able to prevent all disruption but we prioritise investment to continually improve the response and recovery strategies for our most important business services.
Business operations continuity
We continue to monitor the situation in Russia and Ukraine, and remain ready to take measures to help ensure business continuity, should the situation require. There has been no significant impact to our services in nearby markets where the group operates. Publications from the UK Government, EU Commission and the National Grid, amongst others, advised on potential plans for power cuts and energy restrictions across the UK and Continental Europe during the winter period. In light of potential disruption, businesses and functions in these markets are reviewing existing plans and responses to minimise the impact.
| Regulatory compliance risk |
Overview
Regulatory compliance risk is the risk associated with breaching our duty to clients and other counterparties, inappropriate market conduct and breaching related financial services regulatory standards. Regulatory compliance risk arises from the failure to observe relevant laws, codes, rules and regulations and can manifest itself in poor market or customer outcomes and lead to fines, penalties and reputational damage to our business.
Key developments in 2022
The dedicated programme to embed our updated purpose-led conduct approach has concluded. Work to map applicable regulations to our risks and controls continues in 2023 alongside adoption of new tooling to support enterprise-wide horizon scanning for new regulatory obligations and to manage our regulatory reporting inventories. Climate risk has been integrated into regulatory compliance policies and processes, with enhancements being made to the Product Governance Framework and controls in order to ensure the effective consideration of Climate, and in particular Greenwashing, risks.
A major change initiative that begun in 2022 was the introduction of the UK Consumer Duty (which will begin to be implemented in July 2023) and measures resulting from ongoing thematic reviews into the workings of the retail, small to medium enterprises ('SME') and wholesale banking sectors and the provision of financial advice to consumers in the UK particularly. A number of the issues arising from this work have been exacerbated by the cost of living crisis affecting the UK and the EU, and we may see further regulatory intervention as a result, in particular to protect vulnerable customers.
Governance and structure
The structure of the Compliance function is substantively unchanged and the Group Regulatory Conduct capability and Group Financial Crime capability both continue to work closely with the regional Chief Compliance Officers and their respective teams to help them identify and manage regulatory and financial crime compliance risks across the Group. They also work together and with all relevant stakeholders to ensure we achieve good conduct outcomes and provide enterprise-wide support on the Compliance risk agenda in collaboration with the Group's Risk function.
Key risk management processes
The Europe Regulatory Conduct function is engaged in setting policies, standards and risk appetite to guide the management of regulatory compliance. It also devises clear frameworks and support processes to mitigate regulatory compliance risks. The capability provides oversight, review and challenge to the Country Chief Compliance Officers and their teams to help them identify, assess and mitigate regulatory compliance risks, where required. The regulatory compliance risk policies are regularly reviewed. Policies and procedures require the prompt identification and escalation of any actual or potential regulatory breach. Relevant reportable events are escalated to the HSBC Bank plc RMM and to the Group Risk Committee, as appropriate.
Conduct of business
Our conduct approach aims to guide us to do the right thing and to focus on the impact we have on our customers and the financial markets in which we operate. It complements our purpose and values and - together with more formal policies and the tools we have to do our jobs - provides a clear path to achieving our purpose and delivering our strategy. For further information on our Purpose-led Conduct Approach, see www.hsbc.com/who-we-are/esg-and-responsible-business/our-conduct
Regulators and governments
We proactively engage with regulators and governments to facilitate strong relationships through virtual and in-person meetings and by responding to consultations individually and jointly via industry bodies.
| Financial crime risk |
Overview
Financial crime risk is the risk that HSBC's products and services will be exploited for criminal activity. This includes fraud, bribery and corruption, tax evasion, sanctions and export control violations, money laundering, terrorist financing and proliferation financing. Financial crime risk arises from day-to-day banking operations involving customers, third parties and employees.
Key developments in 2022
We regularly review the effectiveness of our financial crime risk management framework, which includes consideration of the complex and dynamic nature of sanctions compliance risk. In 2022, we adapted our policies, procedures and controls to respond to the unprecedented volume and diverse set of sanctions and trade restrictions imposed against Russia following its invasion of Ukraine.
We also continued to make progress with several key financial crime risk management initiatives, including:
• We enhanced our screening and non-screening controls to aid the identification of potential sanctions risk related to Russia, as well as risk arising from export control restrictions.
• We deployed a key component of our intelligence-led, dynamic risk assessment capabilities for customer account monitoring in our Non-Ring Fenced Bank for CMB and in our Jersey market for domestic customers in retail and wholesale, while building toward other markets in Europe. Global Social Network Analysis was deployed in December for correspondent banking in the UK, bringing a broader, more holistic review of potential financial crime risk.
• We reconfigured our transaction screening capability in readiness for the global change to payment systems formatting under ISO20022 requirements, and enhanced transaction screening capabilities by implementing automated alert discounting.
• We strengthened the first party lending fraud framework, reviewed and published an updated fraud policy and associated control library, and continued to develop fraud detection tools.
Governance and Structure
The structure of the Financial Crime function remained substantively unchanged in 2022, although we continued to review the effectiveness of our governance framework to manage financial crime risk. The Regional Head of Financial Crime and HSBC Bank plc Money Laundering Reporting Officer continues to report to the EMEA Head of Compliance, while the HSBC Bank plc Risk Management Meeting retains oversight of matters relating to money laundering, fraud, bribery and corruption, tax evasion, sanctions and export control breaches, terrorist financing and proliferation financing.
Key risk management processes
We will not tolerate knowingly conducting business with individuals or entities believed to be engaged in criminal activity. We require everybody in HSBC to play their role in maintaining effective systems and controls to prevent and detect financial crime. Where we believe we have identified suspected criminal activity or vulnerabilities in our control framework, we will take appropriate mitigating action.
We manage financial crime risk because it is the right thing to do to protect our customers, shareholders, staff, the communities in which we operate, as well as the integrity of the financial system on which we all rely. We operate in a highly regulated industry in which these same policy goals are codified in law and regulation. We are committed to complying with the law and regulation of all the markets in which we operate in HSBC Bank plc and applying a consistently high financial crime standard. In cases where material differences exist between the law and regulation of these markets, our policy adopts the highest standard while acknowledging the primacy of local law.
We continue to assess the effectiveness of our end-to-end financial crime risk management framework, and invest in enhancing our operational control capabilities and technology solutions to deter and detect criminal activity. We have simplified our framework by streamlining and de-duplicating policy requirements. We also strengthened our financial crime risk taxonomy and control libraries and our investigative and monitoring capabilities through technology deployments. We developed more targeted metrics, and have also enhanced our governance and reporting.
We are committed to working in partnership with the wider industry and the public sector in managing financial crime risk, protecting the integrity of the financial system and the communities we serve. We participate in numerous public-private partnerships and information-sharing initiatives around the Europe region, including holding leadership positions in many. In 2022, our focus remained on measures to improve information sharing, including typologies of financial crime and highlighting key tools in the fight against it. Within the European Police agency, Europol, we maintained a presence, and lent our expertise to working groups, as well as advocacy teams focused on how financial crime risk management frameworks can deliver more effective outcomes in detecting and deterring criminal activity, including tackling evolving criminal behaviour such as fraud. We continued our engagement in the Joint Money Laundering Intelligence Task Force in the UK, particularly on sanctions matters.
ESG disclosures
We have continued our efforts to combat financial crime and reduce its impact on our organisation, customers and the communities that we serve. Financial crime includes fraud, bribery and corruption, tax evasion, sanctions and export control violations, money laundering, terrorist financing and proliferation financing.
We are committed to acting with integrity and have built a strong financial crime risk management framework across all global businesses and all countries and territories in which we operate. The financial crime risk framework, which is overseen by the HSBC Bank plc Board, is supported by our financial crime policies that are designed to enable adherence to applicable laws and regulations globally.
Annual mandatory training is provided to all colleagues, with additional targeted training tailored to certain individuals. We carry out regular risk assessments, identifying where we need to respond to evolving financial crime threats, as well as monitor and test our financial crime risk management programme.
We continue to invest in new technology, including through the deployment of a capability to monitor correspondent banking activity, the enhancements to our fraud monitoring capability and our trade screening controls, and the application of machine learning to improve the accuracy and timeliness of our detection capabilities. We are confident our adoption of these new technologies will continue to enhance our ability to respond quickly to unusual activity and be more granular in our risk assessments. This will help us to protect our customers, shareholders, staff, the communities in which we operate and the integrity of the financial system on which we all rely, while providing actionable information to government authorities through our reporting.
Our anti-bribery and corruption policy
Our global AB&C policy requires that all activity must be: conducted without intent to bribe or corrupt; reasonable and transparent; considered to not be lavish nor disproportionate to the professional relationship; appropriately documented with business rationale; and authorised at an appropriate level of seniority. There were no concluded, nor live active, legal cases regarding bribery or corruption brought against HSBC or its employees in 2022. Our global AB&C policy requires that we identify and mitigate the risk of our customers and third parties committing bribery or corruption. We utilise anti-money laundering controls, including customer due diligence and transaction monitoring, to identify and mitigate the risk that our customers are involved in bribery or corruption. We perform a bribery risk assessment on all third parties, and impose risk-based controls on the third parties that expose us to bribery or corruption risk.
Skilled Person & Independent Consultant
In August 2022, the Board of Governors of the Federal Reserve System terminated its 2012 cease-and-desist order, with immediate effect. This order was the final remaining regulatory enforcement action that HSBC had entered into in 2012. In June 2021, the UK Financial Conduct Authority had already determined that no further Skilled Person work was required under section 166 of the Financial Services and Markets Act. The Group Risk Committee retains oversight of matters relating to financial crime, including any remaining remedial activity not yet completed as part of previous recommendations.
In December 2022, the 3-year DPA our Swiss private bank entered into with the DOJ was dismissed. This dismissal confirms that our Swiss private bank complied in all material terms with the DPA obligations by establishing or enhancing the relevant governance, controls, training and internal assurance reviews and allows the private banking business in Switzerland to move forward while maintaining the robust control environment put in place to combat tax evasion in the future.
| Model risk |
Overview
Model risk is the risk of inappropriate or incorrect business decisions arising from the use of models that have been inadequately designed, implemented or used, or from models that do not perform in line with expectations and predictions.
Model risk arises in both financial and non-financial contexts whenever business decision making includes reliance on models.
Key developments in 2022
We managed the risks related to the Russia-Ukraine war and broader macroeconomic and geopolitical uncertainties, as well as the continued risks resulting from the Covid-19 pandemic and other key risks described in this section.
In addition, we enhanced our risk management in the following areas:
• In response to regulatory capital charges, we redeveloped, validated and submitted to the PRA and ECB our models for the internal ratings-based ('IRB') approach for credit risk, internal model method ('IMM') for counterparty credit risk and internal model approach ('IMA') for market risk. These new models have been built to enhanced standards using improved data as a result of investment in processes and systems. We have continued to improve our risk governance decision making, particularly regarding the governance of treasury risk to ensure senior executives have appropriate oversight and visibility of macroeconomic trends around inflation and interest rates.
• We redeveloped and validated models impacted by changes to alternative rate setting mechanisms due to the Ibor transition.
• We embedded the changes made to our control framework for our financial reporting processes to address the control weaknesses that emerged as a result of significant increases in adjustments and overlays that were applied to compensate for the impact of the Covid-19 pandemic on models.
• Our businesses and functions continue to be more involved in the development and management of models, and hiring colleagues who have strong model risk skills. They also put an enhanced focus on key model risk drivers such as data quality and model methodology.
• We enhanced the reporting that supports the model risk appetite measures, to support our businesses and functions in managing model risk more efficiently.
• We continued to support businesses in the programme of work related to climate risk and models using advanced analytics and machine learning, which have become critical areas of focus that will grow in importance in 2023 and beyond. We also added further qualified specialist skills to the model risk teams to manage the increased model risk in these areas.
• We continued the transformation of the Model Risk Management team, with further enhancements to the independent model validation processes, including new systems and working practices. Key senior hires were made during the year to lead the business areas and regions to strengthen oversight and expertise within the function.
Governance and structure
The group's Model Risk Committee is chaired by our Chief Risk Officer and provides oversight of model risk. The committee includes senior leaders and risk owners across the lines of business and Risk and focuses on model-related concerns and key model risk metrics.
Key risk management processes
We use a variety of modelling approaches, including regression, simulation, sampling, machine learning and judgmental scorecards for a range of business applications. These activities include customer selection, product pricing, financial crime transaction monitoring, creditworthiness evaluation and financial reporting. HSBC Bank plc responsibility for managing model risk is delegated from the group's RMM to the group's Model Risk Committee, which is chaired by the group's Chief Risk Officer. This committee regularly reviews our model risk management policies and procedures, and requires the first line of defence to demonstrate comprehensive and effective controls based on a library of model risk controls provided by Model Risk Management.
Model Risk Management also reports on model risk to senior management on a regular basis through the use of risk management information, risk appetite metrics and top and emerging risks.
We regularly review the effectiveness of these processes, including the model oversight committee structure, to help ensure appropriate understanding and ownership of model risk is embedded in the businesses and functions.
| Insurance manufacturing operations risk Overview |
The key risks for our insurance manufacturing operations are market risks, in particular interest rate and equity, credit risks and insurance underwriting risks. These have a direct impact on the financial results and capital positions of the insurance operations. Liquidity risk, whilst significant in other parts of the bank, is relatively minor for our insurance operations.
HSBC's insurance business
We sell insurance products through a range of channels including our branches, insurance salesforces, direct channels and third-party distributors. The majority of sales are through an integrated bancassurance model that provides insurance products principally for customers with whom we have a banking relationship, although the proportion of sales though digital is increasing.
The insurance products we manufacture, the majority of sales are of savings, universal life and protection contracts.
We choose to manufacture these insurance products in HSBC subsidiaries based on an assessment of operational scale and risk appetite. Manufacturing insurance allows us to retain the risks and rewards associated with writing insurance contracts by keeping part of the underwriting profit and investment income within the Group.
Where we do not have the risk appetite or operational scale to be an effective insurance manufacturer, we engage with a small number of leading external insurance companies in order to provide insurance products to our customers. These arrangements are generally structured with our exclusive strategic partners and earn the group a combination of commissions, fees and a share of profits. We distribute insurance products in all of our geographical regions.
Insurance products are sold through all global businesses, but predominantly by WPB and CMB through our branches and direct channels.
Insurance manufacturing operations risk management
Key developments in 2022
The insurance manufacturing subsidiaries follow the Group's risk management framework. In addition, there are specific policies and practices relating to the risk management of insurance contracts. There has been continued market volatility observed over 2022 across interest rates, equity markets and foreign exchange rates. This has been predominantly driven by geopolitical factors and wider inflationary concerns.
One area of key risk management focus over 2022 was the implementation of the new accounting standard, IFRS17 Insurance Contracts. Given the fundamental nature of the impact of the accounting standard on insurance accounting, this presents additional financial reporting and model risks for the Bank.
Governance
Insurance manufacturing risks are managed to a defined risk appetite, which is aligned to the bank's risk appetite and risk management framework, including the three lines of defence model. For details on the governance framework, see page 26. The Group Insurance Risk Management Meeting oversees the control framework globally and is accountable to the WPB Risk Management Meeting on risk matters relating to the insurance business.
The monitoring of the risks within the insurance operations is carried out by Insurance Risk teams. The Bank's risk stewardship functions support the Insurance Risk teams in their respective areas of expertise.
Stress and scenario testing
Stress testing forms a key part of the risk management framework for the insurance business. We participate in local and Group-wide regulatory stress tests, including, as may be required from time to time, the Bank of England
stress test of the banking system, HSBC's Group Internal Stresses, and individual country insurance regulatory stress tests. The results of these stress tests and the adequacy of management action plans to mitigate these risks are considered in the HSBC Bank plc ICAAP and the entities' regulatory Own Risk and Solvency Assessments ('ORSAs').
Management and mitigation of key risk types
Market risk
All our insurance manufacturing subsidiaries have market risk mandates and limits that specify the investment instruments in which they are permitted to invest and the maximum quantum of market risk that they may retain. They manage market risk by using, among others, some or all of the techniques listed below, depending on the nature of the contracts written:
• We are able to adjust bonus rates to manage the liabilities to policyholders for products with discretionary participating features ('DPF'). The effect is that a significant portion of the market risk is borne by the policyholder.
• We use asset and liability matching where asset portfolios are structured to support projected liability cash flows. The Group manages its assets using an approach that considers asset quality, diversification, cash flow matching, liquidity, volatility and target investment return. We use models to assess the effect of a range of future scenarios on the values of financial assets and associated liabilities, and ALCOs employ the outcomes in determining how best to structure asset holdings to support liabilities.
• We use derivatives to protect against adverse market movements.
• We design new products to mitigate market risk, such as changing the investment return sharing portion between policyholders and the shareholder.
Credit risk
Our insurance manufacturing subsidiaries also have credit risk mandates and limits within which they are permitted to operate, which consider the credit risk exposure, quality and performance of their investment portfolios. Our assessment of the creditworthiness of issuers and counterparties is based primarily upon internationally recognised credit ratings and other publicly available information.
Stress testing is performed on investment credit exposures using credit spread sensitivities and default probabilities.
We use a number of tools to manage and monitor credit risk. These include a credit report containing a watch-list of investments with current credit concerns, primarily investments that may be at risk of future impairment or where high
concentrations to counterparties are present in the investment portfolio. Sensitivities to credit spread risk are assessed and monitored regularly.
Capital and liquidity risk
Capital risk for our insurance manufacturing subsidiaries is assessed in the group's ICAAP based on their financial capacity to support the risks to which they are exposed. Capital adequacy is assessed on both the group's economic capital basis, and the relevant local insurance regulatory basis.
Risk appetite buffers are set to ensure that the operations are able to remain solvent, allowing for business-as-usual volatility and extreme but plausible stress events. In certain cases, entities use reinsurance to manage capital risk. Liquidity risk is relatively minor for the insurance business. It is managed by cash flow matching and maintaining sufficient cash resources, investing in high credit-quality investments with deep and liquid markets, monitoring investment concentrations and restricting them where appropriate, and establishing committed contingency borrowing facilities.
Insurance manufacturing subsidiaries complete quarterly liquidity risk reports and an annual review of the liquidity risks to which they are exposed.
Insurance underwriting risk
Our insurance manufacturing subsidiaries primarily use the following frameworks and processes to manage and mitigate insurance underwriting risks:
• a formal approval process for launching new products or making changes to products;
• a product pricing and profitability framework which requires initial and ongoing assessment of the adequacy of premiums
charged on new insurance contracts to meet the risks associated with them;
• a framework for customer underwriting;
• reinsurance which cedes risks to third party reinsurers to keep risks within risk appetite thresholds to third party reinsurer thereby limiting our exposure; and
• oversight of expense and reserving risks by entity Financial Reporting Committees.
Insurance manufacturing operations risk in 2022
Measurement
The following table shows the composition of assets and liabilities by contract type.
| Balance sheet of insurance manufacturing subsidiaries by type of contract |
|||||
| (Audited) |
|||||
|
|
With DPF |
Unit- linked |
Other contracts1 |
Shareholder assets and liabilities |
Total |
|
|
£m |
£m |
£m |
£m |
£m |
| Financial assets |
17,029 |
2,888 |
191 |
2,593 |
22,701 |
| - financial assets designated and otherwise mandatorily measured at fair value through profit or loss |
9,171 |
2,880 |
80 |
1,033 |
13,164 |
| - derivatives |
232 |
- |
- |
11 |
243 |
| - financial investments - at amortised cost |
298 |
- |
- |
20 |
318 |
| - financial investments - at fair value through other comprehensive income |
6,332 |
- |
107 |
1,452 |
7,891 |
| - other financial assets2 |
996 |
8 |
4 |
77 |
1,085 |
| Reinsurance assets |
- |
40 |
112 |
- |
152 |
| PVIF3 |
- |
- |
- |
1,076 |
1,076 |
| Other assets and investment properties |
725 |
1 |
1 |
68 |
795 |
| Total assets at 31 Dec 2022 |
17,754 |
2,929 |
304 |
3,737 |
24,724 |
| Liabilities under investment contracts designated at fair value |
- |
948 |
- |
- |
948 |
| Liabilities under insurance contracts |
17,624 |
2,062 |
301 |
- |
19,987 |
| Deferred tax4 |
129 |
5 |
- |
106 |
240 |
| Other liabilities |
- |
- |
- |
1,796 |
1,796 |
| Total liabilities at 31 Dec 2022 |
17,753 |
3,015 |
301 |
1,902 |
22,971 |
| Total equity at 31 Dec 2022 |
- |
- |
- |
1,753 |
1,753 |
| Total liabilities and equity at 31 Dec 2022 |
17,753 |
3,015 |
301 |
3,655 |
24,724 |
| Financial assets |
19,384 |
2,924 |
254 |
2,704 |
25,266 |
| - financial assets designated and otherwise mandatorily measured at fair value through profit or loss |
9,876 |
2,859 |
89 |
1,236 |
14,060 |
| - derivatives |
47 |
- |
- |
1 |
48 |
| - financial investments - at amortised cost |
815 |
- |
- |
42 |
857 |
| - financial investments - at fair value through other comprehensive income |
7,490 |
- |
104 |
1,327 |
8,921 |
| - other financial assets2 |
1,156 |
65 |
61 |
98 |
1,380 |
| Reinsurance assets |
- |
53 |
104 |
- |
157 |
| PVIF3 |
- |
- |
- |
811 |
811 |
| Other assets and investment properties |
748 |
1 |
- |
59 |
808 |
| Total assets at 31 Dec 2021 |
20,132 |
2,978 |
358 |
3,574 |
27,042 |
| Liabilities under investment contracts designated at fair value |
- |
1,031 |
- |
- |
1,031 |
| Liabilities under insurance contracts |
19,998 |
1,938 |
328 |
- |
22,264 |
| Deferred tax4 |
133 |
6 |
- |
46 |
185 |
| Other liabilities |
- |
- |
- |
2,003 |
2,003 |
| Total liabilities at 31 Dec 2021 |
20,131 |
2,975 |
328 |
2,049 |
25,483 |
| Total equity at 31 Dec 2021 |
- |
- |
- |
1,559 |
1,559 |
| Total liabilities and equity at 31 Dec 2021 |
20,131 |
2,975 |
328 |
3,608 |
27,042 |
1 'Other contracts' includes term assurance and credit life insurance.
2 Comprise mainly loans and advances to banks, cash and intercompany balances with other non-insurance legal entities.
3 Present value of in-force long-term insurance business.
4 'Deferred tax' includes the deferred tax liabilities arising on recognition of PVIF.
Key risk types
Market risk
(Audited)
Description and exposure
Market risk is the risk of changes in market factors affecting the bank's capital or profit. Market factors include interest rates, equity and growth assets and foreign exchange rates. Lapse risk exposure on products with premium financing has increased over the year as rising interest rates have led to an increase in the cost of financing for customers.
Our exposure varies depending on the type of contract issued. Our most significant life insurance products are investment contracts with discretionary participating features ('DPF') issued in France. These products typically include some form of capital guarantee or guaranteed return on the sums invested by the policyholders, to which discretionary bonuses are added if allowed by the overall performance of the funds. These funds are primarily invested in fixed interest assets with a proportion allocated to other asset classes, to provide customers with the potential for enhanced returns.
DPF products expose the bank to the risk of variation in asset returns, which will impact our participation in the investment performance. In addition, in some scenarios the asset returns can become insufficient to cover the policyholders' financial guarantees, in which case the shortfall has to be met by the bank. Amounts are held against the cost of such guarantees. The cost of such guarantees is accounted for as a deduction from the present value of in-force 'PVIF' asset, unless the cost of such guarantees is already explicitly allowed for within the insurance contracts liabilities. The table below shows the total reserve held for the cost of guarantees, the range of investment returns on assets supporting these products and the implied investment return that would enable the business to meet the guarantees. The cost of guarantees decreased to £100m (2021: £299m) primarily due to increases in interest rates and unfavourable equity performances in France. For unit-linked contracts, market risk is substantially borne by the policyholder, but some market risk exposure typically remains as fees earned are related to the market value of the linked assets.
| Financial return guarantees |
||||||
| (Audited) |
||||||
|
|
2022 |
2021 |
||||
|
|
Investment returns implied by guarantee |
Long-term investment returns on relevant portfolios |
Cost of guarantees |
Investment returns implied by guarantee |
Long-term investment returns on relevant portfolios |
Cost of guarantees |
|
|
% |
% |
£m |
% |
% |
£m |
| Capital |
- |
1.6 - 2.0 |
18 |
- |
0.8 - 2.0 |
127 |
| Nominal annual return |
2.6 |
2.0 |
49 |
2.6 |
2.2 |
92 |
| Nominal annual return |
4.5 |
2.0 |
33 |
4.5 |
2.2 |
80 |
| At 31 Dec |
|
|
100 |
|
|
299 |
Sensitivities
The following table illustrates the effects of selected interest rate and equity price scenarios on our profit for the year and the total equity of our insurance manufacturing subsidiaries.
Where appropriate, the effects of the sensitivity tests on profit after tax and equity incorporate the impact of the stress on the PVIF. Due in part to the impact of the cost of guarantees and hedging strategies which may be in place, the relationship between the profit and total equity and the risk factors is non-linear. Therefore, the results disclosed should not be extrapolated to measure sensitivities to different levels of stress.
For the same reason, the impact of the stress is not necessarily symmetrical on the upside and downside.
The sensitivities are stated before allowance for management actions which may mitigate the effect of changes in the market environment. The sensitivities presented allow for adverse changes in policyholder behaviour that may arise in response to changes in market rates. The differences between the impacts on profit after tax and equity are driven by the changes in value of the bonds measured at FVOCI, which are only accounted for in equity.
| Sensitivity of the group's insurance manufacturing subsidiaries to market risk factors |
|||||
| (Audited) |
|||||
|
|
|
2022 |
2021 |
||
|
|
|
Effect on |
Effect on |
Effect on |
Effect on |
|
|
|
£m |
£m |
£m |
£m |
| +100 basis point parallel shift in yield curves |
|
34 |
12 |
119 |
96 |
| -100 basis point parallel shift in yield curves |
|
(48) |
(22) |
(229) |
(203) |
| 10% increase in equity prices |
|
65 |
65 |
46 |
46 |
| 10% decrease in equity prices |
|
(66) |
(66) |
(49) |
(49) |
Credit risk
(Audited)
Description and exposure
Credit risk is the risk of financial loss if a customer or counterparty fails to meet their obligation under a contract. It arises in two main areas for our insurance manufacturers:
• risk associated with credit spread volatility and default by debt security counterparties after investing premiums to generate a return for policyholders and shareholders; and
• risk of default by reinsurance counterparties and non-reimbursement for claims made after ceding insurance risk.
The amounts outstanding at the balance sheet date in respect of these items are shown in the table on page 91. The credit quality of the reinsurers' share of liabilities under insurance contracts is assessed as 'satisfactory' or higher as defined on page 37, with 100% of the exposure being neither past due nor impaired. Credit risk on assets supporting unit-linked liabilities is predominantly borne by the policyholder; therefore our exposure is primarily related to liabilities under non-linked insurance and investment contracts and shareholders' funds.
The credit quality of these financial assets is included in the table on page 57.
Liquidity risk
(Audited)
Description and exposure
Liquidity risk is the risk that an insurance operation, though solvent, either does not have sufficient financial resources available to meet its obligations when they fall due, or can secure them only at excessive cost. Liquidity risk may be able to shared with policyholders for products with DPF.
The following table shows the expected undiscounted cash flows for insurance contract liabilities at 31 December 2022.
The profile of the expected maturity of insurance contracts at
31 December 2022 remained comparable with 2021.
The remaining contractual maturity of investment contract liabilities is included within 'Financial liabilities designated at fair value' in Note 27.
| Expected maturity of insurance contract liabilities |
|||||
| (Audited) |
|||||
|
|
Expected cash flows (undiscounted) |
||||
|
|
Within 1 year |
1-5 years |
5-15 years |
Over 15 years |
Total |
|
|
£m |
£m |
£m |
£m |
£m |
| Unit-linked |
147 |
368 |
818 |
1,433 |
2,766 |
| With DPF and Other contracts |
1,132 |
4,645 |
8,555 |
11,886 |
26,218 |
| At 31 Dec 2022 |
1,279 |
5,013 |
9,373 |
13,319 |
28,984 |
|
|
|||||
| Unit-linked |
230 |
565 |
927 |
926 |
2,648 |
| With DPF and Other contracts |
1,341 |
5,102 |
7,318 |
6,415 |
20,176 |
| At 31 Dec 2021 |
1,571 |
5,667 |
8,245 |
7,341 |
22,824 |
.
Insurance underwriting risk
Description and exposure
Insurance underwriting risk is the risk of loss through adverse experience, in either timing or amount, of insurance underwriting parameters (non-economic assumptions). These parameters include mortality, morbidity, longevity, lapse and expense rates.
The principal risk we face is that, over time, the cost of the contract, including claims and benefits, may exceed the total amount of premiums and investment income received.
The table on page 91 analyses our insurance manufacturing exposures by type of contract.
The insurance risk profile and related exposures remain largely
consistent with those observed at 31 December 2021.
Sensitivities
The table below shows the sensitivity of profit and total equity to reasonably possible changes in non-economic assumptions across all our insurance manufacturing subsidiaries.
Mortality and morbidity risk is typically associated with life insurance contracts. The effect on profit of an increase in mortality or morbidity depends on the type of business being written.
Sensitivity to lapse rates depends on the type of contracts being written. An increase in lapse rates typically has a negative effect on profit due to the loss of future income on the lapsed policies. However, some contract lapses have a positive effect on profit due to the existence of policy surrender charges. We are most sensitive to a change in lapse rates in France.
Expense rate risk is the exposure to a change in the allocated cost of administering insurance contracts. To the extent that increased expenses cannot be passed on to policyholders, an increase in expense rates will have a negative effect on our profits. This risk is generally greatest for smaller entities.
| Sensitivity analysis |
||
| (Audited) |
||
|
|
2022 |
2021 |
|
|
£m |
£m |
| Effect on profit after tax and total equity at 31 Dec |
|
|
| 10% increase in mortality and/or morbidity rates |
(24) |
(20) |
| 10% decrease in mortality and/or morbidity rates |
25 |
19 |
| 10% increase in lapse rates |
(33) |
(19) |
| 10% decrease in lapse rates |
35 |
20 |
| 10% increase in expense rates |
(28) |
(40) |
| 10% decrease in expense rates |
28 |
40 |
| Corporate Governance Report |
The statement of corporate governance practices set out on pages 94 to 102, together with the information incorporated by reference, constitutes the Corporate Governance Report of the bank. The following disclosures, read together with those in the Strategic Report, including the section 172 statement on pages 12 and 14 and reporting on employee engagement on pages 10 to 13 describe how the Board has discharged its responsibilities relating to section 172 of the Companies Act 2006 (the 'Act'), as well as the requirements under the Companies (Miscellaneous Reporting) Regulations 2018 (the 'Reporting Regulations').
Engagement with employees, suppliers, customers and other key stakeholders:
| Customers |
Page 12 |
How we do business |
|
|
Page 12 |
section 172 statement |
| Employees |
Page 12 |
How we do business |
|
|
Pages 12 and 13 |
section 172 statement |
|
|
Pages 101 to 101 |
Corporate Governance statement |
| Communities |
Pages 11 |
How we do business |
| Regulators and governments |
Page 13 |
How we do business |
|
|
Page 12 |
section 172 statement |
| Suppliers |
Page 13 |
How we do business |
|
|
Page 12 |
section 172 statement |
The bank, together with the wider Group, is committed to high standards of corporate governance. The Group has a comprehensive range of principles, policies and procedures influenced by the UK Corporate Governance Code with requirements in respect of Board independence, composition and effectiveness to ensure that the Group is well managed, with appropriate oversight and control. During the year, the bank adhered to these corporate governance principles, policies and procedures, as applicable.
| Board of Directors |
As at 31 December 2022, the Board comprised 10 Directors including the Chair, non-executive Directors, and two executive Directors, being the Chief Executive Officer and the Chief Financial Officer. All Directors are subject to election or re-election at each Annual General Meeting's ('AGM') of the bank. The Directors serving at 31 December 2022 are set out below.
| Directors |
Stephen O'Connor (61)
Chair of the Board
Chair of the Nomination, Remuneration & Governance Committee
Appointed to the Board: May 2018. Chair of the Board since August 2018.
Stephen is a non-executive Director and Vice Chair of HBCE, Chairman of Quantile Group Limited and its subsidiary Quantile Technologies Limited, and a Director of the London Stock Exchange plc. He is also a non-executive Director of the Financial Markets Standards Board. He has more than 25 years' investment banking experience in London and New York.
Former appointments include: Senior Independent Director, Chairman of the Risk Committee and member of both the Audit and Nomination Committees of the London Stock Exchange Group; Chairman of the International Swaps and Derivatives Association; and Managing Director and a member of the Fixed Income Management Committee at Morgan Stanley.
Colin Bell (55)
Executive Director and Chief Executive Officer
Chair of the Executive Committee
Appointed to the Board and as Chief Executive Officer: February 2021.
Colin Bell joined HSBC in July 2016 and most recently held the role of Group Chief Compliance Officer until February 2021. He is a member of the Supervisory Board, and Remuneration, Nomination and Mediation Committees of HSBC Trinkaus & Burkhardt GmbH.
Before joining HSBC, Colin worked at UBS, where he was Global Head of Compliance and Operational Risk Control. He has more than 10 years of experience in managing risk and financial crime, following 16 years in the British Army.
During his time in the Army, he held a variety of command and staff appointments, including operational tours of Iraq and Northern Ireland, time in the Ministry of Defence, a NATO appointment and completion of the Advanced Command and Staff Course.
David Watts (56)
Executive Director and Chief Financial Officer
Member of the Executive Committee
Appointed to the Board and as Chief Financial Officer: December 2021.
David is a Member of the Supervisory Board of HSBC Trinkaus & Burkhardt GmbH. He joined the HSBC Group in 1994 and was previously a Director and Chief Financial Officer of HSBC UK Bank plc.
Former HSBC Group roles include: Chief Financial Officer and Head of Finance for HSBC Bank plc; Chief Financial Officer for Global Commercial Banking; Chief Financial Officer for the Middle East and North Africa, Chief Financial Officer for Group HSBC Technology and Operations; Chief Financial Officer for Global Banking; Head of Financial Control for Global Banking & Markets HSBC Securities (USA) Inc; Head of Group Cost and Investment Reporting & Analysis; and Manager Treasury Services, France.
Patrick Clackson (58)
Independent non-executive Director
Member of the Audit Committee
Appointed to the Board: September 2022.
Former appointments include: Chief Financial Officer, Chief Operations Officer and Chief Executive Officer at Barclays Capital (now Barclays CIB). He also held several non-executive positions whilst with Barclays, BarCap as Head of Business Transformation and Structural Reform, as well as EMEA Chief Executive Officer, Chief Operations Officer, Chief Financial Officer and Head of Risk. Between 1986-1996 he was employed in the audit and financial services advisory teams of PwC, London.
Norma Dove-Edwin (57)
Independent non-executive Director
Member of the Transformation, Operational Resilience and Technology Committee
Appointed to the Board: October 2021.
Norma is as Chief Information Officer of ESO at National Grid Plc. She is also a non-executive Director of Pod Point Group Holdings plc.
Former appointments include: Group Chief Data and Information Officer at Places for People and a number of positions at British American Tobacco Plc including as Head of Global Data Services.
Yukiko Omura (67)
Independent non-executive Director
Member of the Audit Committee
Appointed to the Board: May 2018.
Yukiko is the senior independent non-executive Director of The Private Infrastructure Development Group Limited ('PIDG'). She also serves as a non-executive Director of Assured Guaranty Ltd, and a member of the Supervisory Board of Nishimoto HD Co. Ltd. She has more than 35 years' international professional experience in both the public and private financial sectors, performing senior roles for JP Morgan, Lehman Brothers, UBS and Dresdner Bank.
Yukiko is the Consumer Duty Champion for the Board and helps support the Chair and Chief Executive Officer by encouraging regular dialogue at the Board level on how the Bank is embedding Consumer Duty and focusing on customer outcomes.
Former appointments include: Chair of GuarantCo Limited, a subsidiary of PIDG; Under-Secretary General and COO/Vice President of the International Fund for Agricultural Development; and Executive Vice President and CEO of the Multilateral Investment Guarantee Agency of the World Bank Group.
Juliet Ellis (56)
Independent non-executive Director
Chair of the Transformation, Operational Resilience and Technology Committee, member of the Risk Committee and the Nomination, Remuneration & Governance Committee
Appointed to the Board: January 2021.
Former appointments include: Dual role as European Head of Operations and Global Head of Shared Services and Banking Operations and other senior management positions at Morgan Stanley. Prior to 2007 she performed senior roles within Goldman Sachs International.
Dr Eric Strutz (58)
Independent non-executive Director
Chair of the Risk Committee and member of the Nomination, Remuneration & Governance Committee and Transformation, Operational Resilience and Technology Committee
Appointed to the Board: October 2016.
Eric is a member of the Supervisory Board and Risk Committee and Chair of the Audit Committee of HSBC Trinkaus & Burkhardt GmbH. He is also a director of the HBCE and Chair of the HBCE Risk Committee and member of the HBCE Audit Committee. Other appointments include Chair of the Audit Committee of Global Blue Group Holding AG, and a member of the Advisory Board and Chairman of the Audit & Risk Committee of Luxembourg Investment Company 261 Sarl.
Former appointments include: Vice Chairman and Lead Independent Director of Partners Group Holding AG, where he also Chaired the Risk and Audit Committee; Chief Financial Officer of Commerzbank Group; Partner and Director of the Boston Consulting Group; and non-executive Director of Mediobanca Banca di Credito Finanziario SpA.
John Trueman
Deputy Chairman and non-executive Director
Member of the Audit Committee, the Risk Committee and the Nomination, Remuneration & Governance Committee
Appointed to the Board: September 2004. Deputy Chairman since December 2013.
Former appointments include: Chairman and member of the Risk Committee of HSBC Global Asset Management Limited and Deputy Chairman of S.G. Warburg & Co Ltd.
Andrew Wright (62)
Chair of the Audit Committee and member of the Risk Committee and Nomination, Remuneration & Governance Committee
Appointed to the Board: May 2018.
Andrew is a member of the Supervisory Board and Audit Committee and Chair of the Risk Committee of HSBC Trinkaus & Burkhardt GmbH.
Former appointments include: Treasurer to the Prince of Wales and the Duchess of Cornwall, a role he held from May 2012 until June 2019; Global Chief Financial Officer for the Investment Bank at UBS AG; Chief Financial Officer, Europe and the Middle East at Lehman Brothers; and Chief Financial Officer for the Private Client and Asset Management Division at Deutsche Bank.
| Board Changes during 2022 and following the year-end |
Mary Marsh retired as a Director at the conclusion of the bank's AGM held on 17 May 2022.
Norma Dove-Edwin was appointed as a member of the Transformation, Operational Resilience and Technology Committee with effect from 1 June 2022.
Juliet Ellis was appointed as a member of the Nomination, Remuneration & Governance Committee with effect from 1 August 2022.
Patrick Clackson was appointed as a non-executive Director and member of the Audit Committee with effect from 1 September 2022.
John Trueman retired from the Board as a Director with effect from 31 December 2022.
Lewis O'Donald will join the Board as an independent non-executive Director and member of the Risk Committee with effect from 23 February 2023.
| Company Secretary |
The responsibilities of the Company Secretary include ensuring good governance practices at Board level and effective information flows within the Board and its committees and between senior management and the non-executive Directors.
Alison Campbell was Company Secretary of the bank until
31 December 2022 and Philip Miller was appointed as Company Secretary from 1 January 2023.
| Board of Directors |
Key responsibilities
The Board, led by the Chair, is responsible amongst other matters for:
(i) promoting the long-term success of the bank and delivering sustainable value to shareholders and other stakeholders;
(ii) entrepreneurial leadership of the bank within a framework of prudent and effective controls which enables risks to be assessed and managed;
(iii) setting the bank's strategy and risk appetite statement, including monitoring the bank's risk profile;
(iv) establishing and monitoring the effectiveness of procedures for maintenance of a sound system of control and risk management, and compliance with statutory and regulatory obligations; and
(v) approving the capital and operating plans and material transactions on the recommendation of management.
The role of the non-executive Directors is to support the development of proposals on strategy, hold management to account and ensure the executive Directors are discharging their responsibilities properly by promoting a culture that encourages constructive challenge. Non-executive Directors also review the performance of management in meeting agreed goals and objectives. The Chair regularly meets with the non-executive Directors without executive Directors in attendance after Board meetings, and otherwise, as necessary.
Operation of the Board
During 2022, the Board was required to meet at least four times; seven additional meetings were scheduled to help facilitate, amongst other things, the execution of the bank's transformation strategy, the bank's SEC Registration. The Board agenda is agreed with the Chair, working closely with the Company Secretary, in advance of scheduled meetings. The agenda is informed by forward-looking planning and additional emerging matters that require Board oversight or approval.
The Chief Risk Officer, General Counsel, and Company Secretary are regular attendees at Board meetings, and other senior executives attend to contribute their subject matter expertise and insight, as required.
Board activities during 2022
During 2022, the areas of focus for the Board included in the implementation of approved strategy and execution of the bank's transformation programme across the region, supporting senior management and overseeing performance, risk and capital. The Board considered performance against financial and other strategic objectives, key business challenges, emerging risks, business development and relationships with the bank's key stakeholders.
'Deep dives' on key aspects of the bank's business were also conducted to consider the performance and strategy of targeted businesses and countries. Throughout the year, the Board received regular updates from management including the implementation of regulatory programmes, technology, operations and resilience, as well as people, culture and talent.
In addition, several information and development sessions were facilitated during the year on specific areas of interest including with respect to Recovery and Resolution Planning, technology, and ESG-related matters.
During the year the Board also approved financial, capital, liquidity and funding plans put forward by management and monitored the implementation of plans. Further information on the principal decisions made by the Board during 2022 is located in the section 172 statement on pages 12 to 14.
| Directors' emoluments |
Details of the emoluments of the Directors of the bank for 2022, disclosed in accordance with the Act, are shown in Note 5 'Employee compensation and benefits'.
Non-executive Directors do not have service contracts and are engaged through letters of appointment. There are no obligations in the non-executive Directors' letters of appointment that could give rise to payments other than fees due or payments for loss of office.
| Board committees |
The Board delegates oversight of certain audit, risk, remuneration, nomination and governance matters to its committees. With the exception of the Executive Committee which is chaired by the Chief Executive Officer, each Board committee is chaired by a non-executive Board member and has a remit to cover specific topics in accordance with their respective terms of reference approved by the Board. Only non-executive Directors are members of Board committees. The Chair of each non-executive Board Committee reports to the Board on the activities of the Committee since the previous Board meeting.
Board and Committee effectiveness and performance
The Board understands the importance of, and benefits that derive from regular reviews of the effectiveness of the Board and its committees. An effectiveness review was facilitated by the bank's Company Secretary in 2022 which included a series of interviews with the Directors. Feedback was provided on a number of areas, including the Board's composition and skills, stakeholder engagement, the cadence and logistics of Board meetings, management reporting, Director induction and training, Director and management engagement and debate, and Board priorities for 2022-23. Outcomes and recommendations were reported to the Board and an action plan was produced. Work has progressed during 2022 to address these recommendations.
An annual review of the terms of reference for the Board and its committees was facilitated by the Corporate Governance and Secretariat function. This concluded that the Board and its committees had complied with their respective terms of reference during 2022. Executive Directors are also subject to performance evaluation which helps to determine the level of variable pay they receive each year. At the date of this report, the following are the principal Committees of the Board:
Audit Committee
Key Responsibilities
The Audit Committee is accountable to the Board and has non-executive responsibility for oversight of financial reporting related matters, internal controls over financial reporting and implementation of the group policies and procedures for capturing and responding to whistleblower concerns.
The committee's key responsibilities include:
(i) monitoring and assessing the integrity of the financial statements, formal announcements and supplementary regulatory information in relation to the bank's financial performance;
(ii) reviewing, as applicable, compliance with accounting standards, listing rules, and other requirements in relation to financial reporting;
(iii) reviewing and monitoring the relationship with the external auditor; and
(iv) overseeing the work of Internal Audit and monitoring and assessing the effectiveness, performance, resourcing, independence and standing of the function.
The committee has responsibility for the oversight of the bank's whistleblowing arrangements, and receives regular updates on matters relating to the whistleblowing arrangements that are in place.
Committee activities during 2022
In addition to significant accounting judgements, key matters considered by the committee during the year were regulatory reporting and control enhancements, disposal groups, IFRS 17 implementation, the development of climate-related disclosure, the bank's financial resources and capital, transformation of the Finance function, the independence, fees and performance of the external auditor, PwC UK, and updates on key issues identified by Internal Audit related to the bank and its subsidiaries.
During the year, the committee dedicated time in overseeing management's preparation for the Bank's registration with the U.S. Securities and Exchange Commission ('SEC') and wider programme preparation to achieve compliance with the U.S. Sarbanes-Oxley Act of 2002 ('SOX').
The committee also received updates from the Chairs of the audit committees of key subsidiaries of the Bank, updates from the external auditor on the progress and findings of their audit, and bi-annual updates on the tax position of the bank and its subsidiaries.
Operation of the Committee
The committee held seven scheduled meetings during the year and held separate meetings with each of the Chief Finance Officer, the Chief Risk Officer, the Head of Internal Audit and representatives of the external auditor without management present. An additional meeting was convened in May 2022 to review the bank's draft SEC registration statement and relevant documentation prior to the Board's approval.
The committee meets regularly with the bank's senior financial and Internal Audit management and the external auditors to consider, among other matters, the bank's financial reporting, the
nature and scope of audit reviews, the effectiveness of the systems of internal control relating to financial reporting and the monitoring of the Finance function transformation programme.
The Chief Financial Officer, Financial Controller, Chief Risk Officer, Head of Internal Audit, and Company Secretary are standing attendees and regularly attend committee meetings to contribute their subject matter expertise and insight. Other members of senior management routinely attended meetings of the committee. The external auditor attended all meetings.
During 2022, the committee continued to actively engage with the bank's key subsidiaries and key subsidiary audit committees, with regular reporting throughout the year.
The key subsidiary audit committee chairs attended and participated in the April Audit Committee meeting to consider important HSBC-wide and regional specific matters.
The Chair of the committee regularly meets with the Chair of the Group Audit Committee ('GAC') to help maintain connectivity with the Group and develop deeper understanding on judgements around key matters. Further, from time to time the Chair is invited to attend meetings of the GAC on relevant topics.
The Chair of the GAC also attended a committee meeting in November 2022. The committee comprises three independent non-executive Directors. The current members are Andrew Wright (Chair), Yukiko Omura, and Patrick Clackson.
| Significant accounting judgements and related matters considered by the Audit Committee ('AC') for the year ended 31 December 2022 included: |
|
| Interim and annual reporting |
The AC considered key matters in relation to interim and annual reporting, including changes to segmental reporting and US filings 20-F and 6-K following the bank's registration at the SEC. |
| Disposals |
The AC considered the financial and accounting impacts of the planned disposals of the retail banking business in France, the Greece branch operations and the bank in Russia. In particular, the AC considered judgements related to the timing of recognition of assets as held-for-sale, the re-measurement of those assets and losses arising, which has a significant impact in the year ended 31 December 2022. |
| Expected credit loss ('ECL') |
The AC considered key judgements in relation to ECL, in particular multiple economic scenarios and post-model adjustments due to economic uncertainty and the Russia-Ukraine war. |
| Valuation of financial instruments |
The AC considered key valuation metrics and judgements involved in the determination of the fair value of financial instruments. The AC also considered management's analysis of exit losses upon the novation of certain derivative portfolios and the determination that there was insufficient evidence to support the introduction of fair value adjustments in respect of these. |
| Going concern |
The AC considered a wide range of information relating to present and potential conditions, including projections for profitability, cash flows, liquidity and capital. |
| Impairment of investment in subsidiaries |
The AC reviewed management's periodic assessment of impairment of investments in subsidiaries and paid particular attention to the sensitivities to cash flow projections and long-term growth rate and discount rate assumptions. Management assessed that there had been a partial reversal of impairment of the bank's investment in HBCE in the year ended 31 December 2022, with due regard to the planned sale of the retail banking business in France. |
| Appropriateness of provisioning for legal proceedings and regulatory matters |
The AC received reports from management on the recognition and measurement of provisions and contingent liabilities for legal proceedings and regulatory matters, including investigations by regulators and competition and law-enforcement authorities. |
| Regulatory reporting |
The AC reviewed management's efforts to strengthen and simplify the end-to-end operating and control model, including independent external reviews of key aspects of regulatory reporting. |
| IBOR transition |
The AC considered the implications of benchmark interest rate reform, including the recognition and measurement of financial instruments and related disclosures. |
| Controls |
The AC considered the financial control environment on an ongoing basis through the year, reviewing and challenging remediation actions undertaken and enhancements made. This included confirmation of mitigating controls where programmes of work had not fully completed by the year end. Areas of particular focus in 2022 have been Model Risk Governance, controls over use of external market data, accounting and tax implications of Merger and Acquisition ('M&A') transactions, general ledger substantiation and Financial Statement Disclosures. |
| Tax |
The AC reviewed management's judgements on the recognition and measurement of deferred tax assets and liabilities, in particular those arising from the planned sale of retail banking activities in France, and the accounting and disclosure of retrospective VAT assessments issued by HMRC. |
| Environmental, Social and Governance ('ESG') Reporting |
The AC considered regulatory developments in ESG Reporting, in particular at 31 December 2022 for bank subsidiaries in the European Union. |
| IFRS 17 implementation |
The AC reviewed accounting policy judgements in relation to the retrospective implementation of IFRS 17 Insurance Contracts on 1 January 2023, and preparation of transitional disclosure. |
| Restructuring provisions |
The AC considered key judgements in relation to restructuring provisions, mainly relating to transformation in Continental Europe and Germany. |
Risk Committee
Key Responsibilities
The Risk Committee is accountable to the Board and has overall non-executive responsibility for oversight of risk-related matters and the risks impacting the bank.
The committee's key responsibilities include:
(i) advising the Board on risk appetite and risk tolerance related matters;
(ii) reviewing and recommending key regulatory submissions to the Board;
(iii) overseeing and advising the Board on all risk-related matters, including financial and non-financial risks and reviewing the effectiveness of the bank's conduct framework;
(iv) reviewing, challenging and satisfying itself that the bank's stress testing framework, governance and internal controls are robust; and
(v) reviewing the effectiveness of the bank's risk management framework and internal control systems (other than internal financial controls overseen by the Audit Committee).
Committee activities during 2022
Key matters considered by the committee during the year included the bank's approach to the financial and non-financial risks in the context of capital and liquidity, retail, wholesale credit and market risks including, financial crime and fraud, geopolitical, operational, people and climate-related risks.
The committee also reviewed and challenged management on key regulatory processes, including the bank's internal capital adequacy assessment process ('ICAAP') and the internal liquidity adequacy assessment process ('ILAAP'), recovery and resolution plans, the outcome of stress tests (including annual cyclical scenario, cyber and solvency) undertaken during the year, and the bank's capital liquidity and funding plans.
Deep dives on key aspects of the bank's business were conducted to consider specific climate risk related matters including the bank's thermal coal phase-out policy.
The committee worked closely with the Transformation, Operational Resilience and Technology Committee during the year to ensure appropriate alignment in the review and discussion on operational resilience and technology risk-related matters.
Operation of the Committee
The committee held eight scheduled meetings during the year. The Chief Risk Officer, Chief Financial Officer and Head of Internal Audit are standing attendees and regularly attend committee meetings to contribute their subject matter expertise and insight. The Chair and members of the committee also hold private meetings with the Chief Risk Officer, following quarterly scheduled meetings.
The committee reviews and challenges current and forward-looking risk issues, and the regional senior business leaders are regularly invited to participate at committee meetings, working together with functional and regional leaders across all three lines of defence.
The Chair and members of the committee meet regularly with the bank's senior financial, risk, internal audit and compliance management and the external auditors to consider and discuss, among other matters, specific risk matters and priorities, risk reports and internal audit reports and the effectiveness of compliance activities. The Chair meets regularly with the committee secretary to ensure the committee meets its governance responsibilities.
During 2022 the committee continued to actively engage with the bank's key subsidiaries and key subsidiary risk committees, with regular reporting from the respective Chairs throughout the year. The Chair of the committee attended several Group-led meetings to help promote connectivity, escalation and cascade of important topics. The committee comprises a majority of independent
non-executive Directors.
The current members are Eric Strutz (Chair), Juliet Ellis and Andrew Wright.
Transformation, Operational Resilience and Technology Committee
Key Responsibilities
The Transformation, Operational Resilience and Technology Committee was established to assist the Board and Risk Committee with their respective responsibilities in relation to the bank's transformation strategy, operational resilience, as well as the governance and oversight of technology. During the year, on recommendation of the Board, the Group Nomination & Corporate Governance Committee approved the continuation of the committee to continue necessary engagement allowing a more detailed oversight of the matters within its remit.
The committee's key responsibilities include:
(i) reviewing progress of the transformation strategy and the steps management have taken to manage risk, and to monitor progress against set objectives;
(ii) reviewing the effectiveness of governance frameworks to set and oversee the internal control environment in relation to technology;
(iii) reviewing regional technology strategy, ensuring it is aligned with the adopted business strategies of the bank; and
(iv) overseeing and challenging management on execution of operational resilience objectives and deliverables.
Committee activities during 2022
Key matters considered by the committee during the year included review and oversight of Information Technology ('IT') and Cloud strategies and governance, the bank's operating systems, operational resilience and technology infrastructure, including operational resilience of critical IT and other business services, information and cyber security risks, and major IT change programmes. The committee also reviewed and challenged management on the progress and associated risks with respect of the transformation strategy, including transformation governance, key change programmes and initiatives underway, including those related to outsourced technology services and meeting regulatory requirements and expectations.
Operation of the Committee
The committee held seven scheduled meetings during 2022.
The Board Chair, Chief Operating Officer, Chief Information Officer, Chief Risk Officer, Head of Internal Audit, and Head of Strategy and Planning, Chief of Staff (Europe CEO), are standing attendees and regularly attend Committee meetings to contribute their subject matter expertise and insight.
The current members are Juliet Ellis (Chair), Norma Dove-Edwin, and Eric Strutz.
Nomination, Remuneration & Governance Committee
Key Responsibilities
The Nomination, Remuneration & Governance Committee has responsibility for:
(i) leading the process for Board appointments and for identifying and nominating, for the approval of the Board, candidates for appointment to the Board and its committees;
(ii) the endorsement of the appointment of individuals to certain Board and management positions of the bank's subsidiaries, including proposed fees payable to non-executive Directors on subsidiary boards;
(iii) reviewing the implementation and appropriateness of the Group's director remuneration policy and the remuneration of the bank's senior executives, including the identification of the Material Risk Taker population for the purposes of the CRD;
(iv) reviewing and developing the corporate governance framework on behalf of the Board and ensuring it is consistent with best corporate governance standards and practices while remaining appropriate to the size, complexity and strategy of the bank; and
(v) overseeing compliance with the HSBC Group Subsidiary Accountability Framework ('SAF').
Further information in relation to HSBC's approach to remuneration for group employees is available in the Director's remuneration report on pages 276-278 of HSBC's Annual Report and Accounts 2022 available on https://www.hsbc.com/investors/results-and-announcements/annual-report.
Committee activities during 2022
As a UK regulated subsidiary of HSBC Holdings plc, the bank has both internal and external responsibilities for succession planning. During the year the committee undertook a review of its succession plan and the Board and Board Committee's composition in keeping with best practice and applicable policies, including SAF.
As part of its review, the committee identified opportunities to further strengthen the skills and experience required for the Board. The committee commenced a search process to identify a new non-executive Director for appointment to the Board with a successful recommendation to the Board for approval secured in the appointment of Patrick Clackson. Further information in relation to Board and committee changes throughout the year can be found on page 95.
Additionally, the committee reviewed and approved an updated Board Continuity Plan ('BCP') which is in place to cover any unexpected or temporary absence of non-executive Directors who hold SMF responsibilities in relation to the Bank.
In overseeing compliance with SAF, the committee reviewed of the Board composition and succession planning for all of the bank's material subsidiaries.
Other activities during the year included, the review of key remuneration matters for the bank and its subsidiaries in the context of HSBC's remuneration framework, including variable and fixed pay allocations, aligned with the bank's risk appetite, and in keeping with the bank's strategy, culture and values, and long-term interests of the bank.
The committee reviewed the annual pay review outcomes across the region and received regular updates on relevant subsidiary and regulatory matters.
Operation of the Committee
The committee held seven scheduled meetings during 2022, with additional meetings arranged to consider specific matters.
The Head of HR and Head of Performance & Reward attend committee meetings on a regular basis to contribute their subject matter expertise and insight. Other senior executives attend periodically for specific items considered by the committee.
The committee comprises four non-executive Directors. The current members are: Stephen O'Connor (Chair), Juliet Ellis, Eric Strutz, and Andrew Wright.
Executive Committee
The Executive Committee is a committee of the Board and has overall executive responsibility, under formal delegation, for the management and day-to-day running of the bank. The Committee is accountable to the Board for overseeing the execution of the bank's strategy.
The purpose of the Committee is to support the Chief Executive Officer of the bank in the performance of their duties and exercise of their powers, authorities and discretions in relation to the management of the bank and its subsidiaries. The committee meets on a regular basis and is chaired by the Chief Executive Officer.
During 2022, in addition to its day-to-day oversight of the bank's operations, the committee reviewed business plans in light of geopolitical and macroeconomic developments in keeping with the Bank's approved Risk Framework and Risk Appetite prior to formal recommendation to the Board for approval. The committee remained focused on the Bank's strategic transformation and corporate restructuring across Europe, including the country exit of Russia, sale of branch operations in Greece and retail banking operations in France and the regulatory requirement to establish an IPU following the UK's departure from the European Union. The committee is responsible for oversight of the performance across the bank's lines of business, review of the bank's financial performance, cost management, and preparing the bank's forward looking Financial Resource Plan. The committee received updates on regulatory remediation programmes and regulatory engagement themes across the region.
| Dividends |
Information about dividends paid during the year is provided on page 20 of the Strategic Report and in Note 8 to the financial statements.
| Internal control |
The Board is responsible for the establishment and operation of effective procedures for the maintenance of a sound system of internal control and risk management, adequate accounting, and compliance with statutory and regulatory obligations. The Board determine the aggregate level and types of risks the bank is willing to take in achieving its strategic objectives.
To meet this requirement and to discharge its obligations under the FCA Handbook and the PRA Handbook, procedures have been designed for safeguarding assets against unauthorised use or disposal, for maintaining proper accounting records, and for ensuring the reliability and usefulness of financial information used within the business or for publication.
These procedures provide reasonable assurance against material misstatement, errors, losses or fraud. They are designed to provide effective internal control within the group and accord with the Financial Reporting Council's guidance for Directors issued in 2014 (and subsequent relevant publications), internal control and related financial and business reporting. The procedures have been in place throughout the year and up to 20 February 2023, the date of approval of this Annual Report and Accounts 2022.
The key risk management and internal control procedures include the following:
• Global principles: The HSBC Group's Global Principles set an overarching standard for all other policies and procedures and are fundamental to the Group's risk management structure. They inform and connect our purpose, values, strategy and risk management principles, guiding us to do the right thing and treat our customers and our colleagues fairly at all times.
• Risk management framework ('RMF'): The RMF supports our Global Principles. It outlines the key principles and practices that we employ in managing material risks. It applies to all categories of risk and supports a consistent approach in identifying, assessing, managing and reporting the risks we accept and incur in our activities.
• Delegation of authority within limits set by the Board: Subject to certain matters reserved for the Board, the Chief Executive Officer has been delegated authority limits and powers within which to manage the day-to-day affairs of the bank, including the right to sub-delegate those limits and powers. Each relevant executive has authority within which to manage the day-to-day affairs of the business or function for which he or she is accountable. Those individuals are required to maintain a clear and appropriate apportionment of significant responsibilities and to oversee the establishment and maintenance of systems of control that are appropriate to their business or function. Authorities to enter into credit and market risk exposures are delegated with limits to line management of group companies. However, credit proposals with specified higher-risk characteristics require the concurrence of the appropriate global function. Credit and market risks are measured and reported at subsidiary company level and aggregated for risk concentration analysis on a group-wide basis.
• Risk identification and monitoring: Systems and procedures are in place to identify, assess, control and monitor the material risk types facing the group as set out in the RMF. The group's risk measurement and reporting systems are designed to help ensure that material risks are captured with all the attributes necessary to support well-founded decisions, that those attributes are accurately assessed and that information is delivered in a timely manner for those risks to be successfully managed and mitigated.
• Changes in market conditions/practices: Processes are in place to identify new risks arising from changes in market conditions/practices or customer behaviours, which could expose the group to heightened risk of loss or reputational damage. The group employs a top and emerging risks framework, which contains an aggregate of all current and forward-looking risks and enables it to take action that either prevents them materialising or limits their impact.
• Responsibility for risk management: All employees are responsible for identifying and managing risk within the scope of their role as part of the three lines of defence model. This is an activity-based model to delineate management accountabilities and responsibilities for risk management and the control environment. The second line of defence sets the policy and guidelines for managing specific areas, provides advice and guidance in relation to the risk, and challenges the first line of defence (the risk owners) on effective risk management.
• The Board has delegated to the Audit Committee oversight for the implementation of the group's policies and procedures for capturing and responding to whistleblower concerns, ensuring confidentiality, protection and fair treatment of whistleblowers, and receiving reports arising from the operation of those policies as well as ensuring arrangements are in place for independent investigation.
• Strategic plans: Strategic plans are prepared for global businesses, global functions and geographical regions within the framework of the HSBC Group's overall strategy. The bank also prepares and adopts a Financial Resource Plan, which is informed by detailed analysis of risk appetite, describing the types and quantum of risk that the bank is prepared to take in executing its strategy and sets out the key business initiatives and the likely financial effects of those initiatives.
• The effectiveness of the group's system of risk management and internal control is reviewed regularly by the Board, the Risk Committee and the Audit Committee.
• During 2022, the group continued to focus on operational resilience and invest in the non-financial risk infrastructure. There was a particular focus on material and emerging risks with progress made enhancing the end-to-end risk and control assessment process. The Risk Committee, supported by the TRT, and the Audit Committee received confirmation that executive management continued to take efforts to effect the necessary actions to remedy any failings or weaknesses identified through the operation of the group's framework of controls.
Internal control over financial reporting
The key risk management and internal control procedures over financial reporting include the following:
• Entity level controls ('ELC'): The primary mechanism through which comfort over risk management and internal control systems is achieved, is through assessments of the effectiveness of controls to manage risk, and the reporting of risk and control issues on a regular basis through the various risk management and risk governance forums. ELCs are a defined suite of internal controls that have a pervasive influence over the entity as a whole.
They include controls related to the control environment, such as the bank's values and ethics, the promotion of effective risk management and the overarching governance exercised by the Board and its non-executive committees. The design and operational effectiveness of ELCs are assessed annually as part of the assessment of the effectiveness of internal controls over financial reporting. If issues are significant to the group, they are notified to the Risk Committee, and also to the Audit Committee if concerning financial reporting matters.
• Process level transactional controls: Key process level controls that mitigate risk of financial misstatement are identified, recorded and monitored in accordance with the risk framework. This includes the identification and assessment of relevant control issues against which action plans are tracked through to remediation. Further details on the group's approach to risk management can be found on page 26. The Audit Committee has continued to receive regular updates on HSBC's ongoing activities for improving the effective oversight of end-to-end business processes and management continues to identify opportunities for enhancing key controls, such as through the use of automation technologies.
• External Reporting Forum: The External Reporting Forum reviews financial reporting disclosures to be made by the bank for accuracy and completeness. The integrity of disclosures is underpinned by structures and processes within the group's Finance and Risk functions that support rigorous analytical review of financial reporting and the maintenance of proper accounting records.
• Disclosure Committee: Chaired by the Chief Financial Officer, the committee supports the discharge of the bank's obligations under relevant legislation and regulation including the European Union's Market Abuse Regulation ('EU MAR'), as amended by the Market Abuse (Amendment) (EU Exit) Regulations 2019, the New York Stock Exchange's Listed Company Manual, U.S. Securities law and the rules and regulations of the SEC, and also any other listing and disclosure rules of the markets and exchanges on which the bank's financial instruments are listed, including any other requirements that shall apply from time to time.
• Financial reporting: The group's financial reporting process is controlled using documented accounting policies and reporting formats, supported by detailed instructions and guidance on reporting requirements, issued to all reporting entities within the group in advance of each reporting period end. The submission of financial information from each reporting entity is supported by a certification by the responsible financial officer and analytical review procedures at subsidiary and group levels.
• Subsidiary certifications: Certifications are provided to the Audit Committee and the Risk Committee (full and half yearly) and to the Nomination, Remuneration and Governance Committee (annually) from the audit, risk and remuneration committees of key material subsidiary companies confirming amongst other things that:
- Audit - the financial statements of the subsidiary have been prepared in accordance with group policies, present fairly the state of affairs of the subsidiary and are prepared on a going concern basis;
- Risk - the risk committee of the subsidiary has carried out its oversight activities consistent with and in alignment to the RMF; and
- Remuneration - the remuneration committee of the subsidiary has discharged its obligations in overseeing the implementation and operation of HSBC's Group Remuneration Policy.
-
| Employees |
Health and safety
We are committed to providing a safe and healthy working environment for everyone. We have adopted global policies, mandatory procedures, and incident and information reporting systems across the organisation that reflect our core values and are aligned to international standards. Our global health and safety performance is subject to ongoing monitoring and assurance.
Our Chief Operating Officers have overall responsibility for engendering a positive health and safety culture and ensuring that global policies, procedures and systems are put into practice locally. They also have responsibility for ensuring all local legal requirements are met.
We delivered a range of programmes in 2022 to help us understand and manage our health and safety risks:
• We continued to provide enhancements to our workplaces to minimise the risks of Covid-19, including enhancing cleaning, improved ventilation and social distancing measures
• We updated our advice and risk assessment methodology on working from home, providing more awareness and best practices on good ergonomics and wellbeing to be adopted as we transitioned to new ways of working upon return to the office
• We delivered health and safety training and awareness to employees and contractors ensuring roles and responsibilities were clear and understood, especially in higher risk environments
• We completed the annual safety inspection on all of our buildings, to ensure we were meeting our standards and continuously improving our safety performance
• We continued to focus on enhancing the safety culture in our supply chain through our SAFER Together programme, covering the five key elements of best practice safety culture, including speaking up about safety, and recognising excellence
• Our Safety Climate Survey continued to show high results and recognised that we encourage suggestions on how to improve health and safety and have good processes in place to communicate health and safety messages
• Our Eat Well Live Well programme continued to be rolled out, notably in France and Germany, educating and informing our colleagues on how to make healthy food and drink choices. We enhanced the programme to provide digital educational and information resources, including a suite of videos and recipe ideas and to provide healthy vending options.
• Protection of our colleagues and operations is of critical importance and we have effective controls in place to protect our people from natural disasters (i.e. storms and earthquakes). In 2022, there were 38 named storms that passed over 1,667 of our buildings, resulting in 0 injuries or material business impact.
| Employee health and safety |
|||
|
|
2022 |
2021 |
2020 |
| Number of workplace fatalities |
- |
- |
- |
| Number of major injuries to employees1 |
- |
2 |
3 |
| All injury rate per 100,000 employees |
49 |
35 |
130 |
1 Fractures, dislocation, concussion, hospitalisation, unconsciousness.
Diversity and Inclusion
Our purpose, 'Opening up a world of opportunity', explains why we exist as an organisation and is the foundation of our diversity and inclusion strategy. Promoting diversity and fostering inclusion contributes to our 'energise for growth' priority. By valuing difference, we can make use of the unique expertise, capabilities, breadth and perspectives of our colleagues to the benefit of our customers. To achieve progress, we are focused on specific region-wide priorities for which we hold senior executives
accountable. We are pleased to report on key progress made in 2022:
Achievements
• We have set up a HSBC Bank plc Diversity and Inclusion Council, chaired by the HSBC Bank plc CEO and consisting of the European Executive Committee to reinforce our commitments, engage more closely with our Employee Resources Groups and track progress and accountability.
• Throughout 2022, we arranged multiple events and conferences to support our colleagues across our European countries, including ethnicity conferences attended by over 600 colleagues, 6 disability awareness events and six ethnicity exchanges in French and English.
• We have continued supporting colleagues through our ERGs; we now have 47 ERGs in 20 markets across six diversity strands.
• We have created D&I objectives for European people managers.
• Focus on developing our middle management female colleagues through our flagship programmes 'uGrow' and 'Accelerated Female Leaders'.
• We have a black heritage action plan in place to support our ethnicity goals, including a Black Heritage Sponsorship Programme being run in Global Banking and Markets.
• 3000+ hours spent on Inclusion Learning across the region
• 47.9% of employees in the UK, Channels Islands and Isle of Man and South Africa have declared their ethnicity in our 'HR Direct' system
Gender diversity statistics
Our overall female representation is improving and we are committed to building a strong pipeline of female talent to improve gender balance in senior leadership across Europe. By the end of 2022, we had reached 24.6% and are committed to doing more going forward.
Female representation by management level:
All grades - 51.9%
GCB 6-8 Clerical grades - 65.1%
GCB 4-5 Management - 43.7%
GCB 0-3 Senior management - 24.6%
Employment of people with a disability
We strongly believe in providing equal opportunities for all employees. The employment of people with a disability is included in this commitment. The recruitment, training, development and promotion of people with a disability are based on the aptitudes and abilities of the individual. Should employees become disabled during their employments with us, efforts are made to continue their employment. Where necessary, we will provide appropriate training, facilities and reasonable equipment. For example, we recently established a telephone platform for instant sign translation for our deaf colleagues in France where the sign language translators exchange sign language by video.
A number of countries have dedicated teams to ensure that barriers to work are removed for colleagues. Our Employee Resource Groups ('ERG'), supported by HR and business leadership are doing an important job of breaking down barriers. They offer a space for discussion between those with a disability and their allies for exchanges of inclusive best practices.
Continuous work is done to ensure individual support is provided to make home office adjustments.
Learning and talent development
We aim to build a dynamic environment where our colleagues can develop skills and undertake experiences that help them fulfil their potential. Our approach helps us to meet our strategic priorities and support our colleagues' career goals.
We expect all colleagues, regardless of their contract type, to complete global mandatory training each year. This training plays a critical role in shaping our culture, ensuring a focus on the issues that are fundamental to our work - such as sustainability, financial crime risk, and our intolerance of bullying and harassment. New joiners attend our Global Discovery programme designed to build their knowledge of the organisation and engage them with our purpose, values and strategy.
HSBC University remains our home for skills development with access to face to face training and an extensive catalogue of digital content from partners such as LinkedIn Learning, Harvard Business Review podcast and Microsoft Learn. Powered by Degreed, our HSBC University platform provides tailored content aligned to employees chosen skills and development areas. Our Leadership development partners include Imperial College and London Business Schools who we work with on topics of strategic importance. For example, we launched the HSBC University Sustainability Academy in October 2022 providing a wealth of knowledge articles and structured learning pathways to grow awareness of climate and wider social sustainability matters that HSBC and its employees can play a role in resolving.
My HSBC Career Portal is also available to all our employees which offers career development information and resources to help colleagues manage the various stages of their career, from joining through to career progression. However, we also recognise that most development happens while our colleagues work, through regular coaching, feedback, and performance management and we will extend the use of the HSBC Talent Marketplace platform in Europe in 2023 (the platform is already live in the UK). This will connect our employees to 'on the job' development opportunities across the HSBC Group, by means of matching individuals existing skills and career aspirations to live projects within the Group. HSBC Europe will also be able to call upon talent that exists across the Group, to supplement its own personnel, in the development of local initiatives and projects.
Employee relations
We consult with and, where appropriate, negotiate with employee representative bodies where we have them. We also aim to maintain well-developed communications and consultation programmes with all employee representative bodies and there have been no material disruptions to our operations from labour disputes during the past five years.
| Disclosure of information to auditors |
The directors are not aware that there is any relevant audit information (as defined in the Companies Act 2006) of which the bank's auditors are unaware and processes are in place to ensure that the bank's auditors are aware of any relevant audit information.
| Auditors |
PricewaterhouseCoopers LLP ('PwC') are the external auditors to the bank. PwC has expressed its willingness to continue in office and the Board recommends that PwC be re-appointed as the bank's auditors. A resolution proposing the re-appointment of PwC as the bank's auditors, and giving authority to the Audit Committee to determine its remuneration, will be submitted to the forthcoming AGM.
| Branches |
HSBC Bank plc provides a wide range of banking and financial services through 20 markets. HSBC Bank plc is simplifying its operating model to one integrated business supporting a wholesale banking hub for the EU in Paris and a wholesale banking hub for western markets in London. Further information on the bank's branches are located in 'HSBC in Europe' on page 6.
Disclosures required pursuant to the Large and Medium-sized Companies and Groups (Accounts and Reports) Regulations 2008 as updated by Companies (Miscellaneous Reporting) Regulations 2018 can be found on the following pages:
| Engagement with employees (Sch.7 Para 11 and 11A 2008/2018 Regs), s172 Statement) |
Pages 12 and 13 |
| Engagement with suppliers, customers and others in a business relationship with the bank (Sch.7 Para 11B 2008 Regs) |
Pages 12 and 13 |
| Policy concerning the employment of disabled persons (Sch.7 Para 10 2008 Regs) |
Page 101 |
| Financial Instruments (Sch.7 Para 6 2008 Regs) |
Pages 36 to 75 |
| Hedge accounting policy (Sch.7 Para 6 2008 Regs) |
Note 14, Pages 159 to 164 |
| Articles of Association, Conflicts of interest and indemnification of Directors |
The bank's Articles of Association gives the Board authority to approve Directors' conflicts and potential conflicts of interest. The Board has adopted policies and procedures for the approval of Directors' conflicts or potential conflicts of interest. On appointment, new Directors are advised of the process for dealing with conflicts and a review of those conflicts that have been authorised, and the terms of those authorisations, is routinely undertaken by the Board.
The Articles of Association of the bank contain a qualifying third-party indemnity provision, which entitles Directors and other officers to be indemnified out of the assets of the bank against claims from third parties in respect of certain liabilities. HSBC Group has granted, by way of deed poll, indemnities to the Directors, including former Directors who retired during the year, against certain liabilities arising in connection with their position as a Director of any Group company, including the bank and its subsidiaries. Directors are indemnified to the maximum extent permitted by law.
The indemnities that constitute a 'qualifying third-party indemnity provision', as defined by section 234 of the Companies Act 2006, remained in force for the whole of the financial year (or, in the case of Directors appointed during 2022, from the date of their appointment). The deed poll is available for inspection at the registered office of HSBC Holdings plc.
Additionally, Directors have the benefit of Directors' and Officers' liability insurance. Qualifying pension scheme indemnities have also been granted to the Trustees of the Group's pension schemes, which were in force for the whole of the financial year and remain in force as at the date of this report.
| Research and Development |
In the ordinary course, the lines of business develop new products and services.
| Events after the Balance Sheet Date |
In its assessment of events after the balance sheet date, the group has considered and concluded that there are no events requiring adjustment or disclosures in the financial statements.
| Statement on going concern |
The Directors consider it appropriate to prepare the financial statements on the going concern basis. In making their going concern assessment, the Directors have considered a wide range of detailed information relating to present and potential conditions, including profitability, cash flows, capital requirements and capital resources.
Further information relevant to the assessment is provided in the Strategic Report and the Report of the Directors, in particular:
• a description of the group's strategic direction;
• a summary of the group's financial performance and a review of performance by business;
• the group's approach to capital management and its capital position; and
• the top and emerging risks facing the group, as appraised by the Directors, along with details of the group's approach to mitigating those risks and its approach to risk management in general.
In addition, the objectives, policies and processes for managing credit, liquidity and market risk are set out in the 'Report of the Directors: Risk'.
The Report of the Directors comprising pages 26 to 102 was approved by the Board on 20 February 2023 and is signed on its behalf:
By order of the Board
David Watts
Director
HSBC Bank plc
20 February 2023
Registered number 00014259
| Statement of directors' responsibilities in respect of the financial statements |
The directors are responsible for preparing the Annual Report and the financial statements in accordance with applicable law and regulation.
Company law requires the directors to prepare financial statements for each financial year. Under that law the directors have prepared the group and the company financial statements in accordance with UK-adopted international accounting standards. In preparing the group and company financial statements, the directors have also elected to comply with International Financial Reporting Standards issued by the International Accounting Standards Board (IFRSs as issued by IASB).
The group and company have also prepared financial statements in accordance with international financial reporting standards adopted pursuant to Regulation (EC) No 1606/2002 as it applies in the European Union.
Under company law, directors must not approve the financial statements unless they are satisfied that they give a true and fair view of the state of affairs of the group and company and of the profit or loss of the group for that period. In preparing the financial statements, the directors are required to:
• select suitable accounting policies and then apply them consistently;
• state whether applicable UK-adopted international accounting standards, international financial reporting standards adopted pursuant to Regulation (EC) No 1606/2002 as it applies in the European Union and IFRSs issued by IASB have been followed, subject to any material departures disclosed and explained in the financial statements;
• make judgements and accounting estimates that are reasonable and prudent; and
• prepare the financial statements on the going concern basis unless it is inappropriate to presume that the group and company will continue in business.
The directors are responsible for safeguarding the assets of the group and company and hence for taking reasonable steps for the prevention and detection of fraud and other irregularities.
The directors are also responsible for keeping adequate accounting records that are sufficient to show and explain the group's and company's transactions and disclose with reasonable accuracy at any time the financial position of the group and company and enable them to ensure that the financial statements comply with the Companies Act 2006.
The directors are responsible for the maintenance and integrity of the company's website. Legislation in the United Kingdom governing the preparation and dissemination of financial statements may differ from legislation in other jurisdictions.
Directors' confirmations
Each of the directors, whose names and functions are listed in Corporate Governance Report confirm that, to the best of their knowledge:
• the group and company financial statements, which have been prepared in accordance with UK-adopted international accounting standards, international financial reporting standards adopted pursuant to Regulation (EC) No 1606/2002 as it applies in the European Union and IFRSs issued by IASB, give a true and fair view of the assets, liabilities and financial position of the group and company, and of the loss of the group; and
• the Strategic Report includes a fair review of the development and performance of the business and the position of the group and company, together with a description of the principal risks and uncertainties that it faces.
On behalf of the Board
David Watts
Director
HSBC Bank plc
20 February 2023
Registered number 00014259
| Independent auditors' report to the members of HSBC Bank plc |
| Report on the audit of the financial statements |
Opinion
In our opinion, HSBC Bank plc's group financial statements and company financial statements (the 'financial statements'):
• give a true and fair view of the state of the group's and of the company's affairs as at 31 December 2022 and of the group's loss and the group's and company's cash flows for the year then ended;
• have been properly prepared in accordance with UK-adopted international accounting standards as applied in accordance with the provisions of the Companies Act 2006; and
• have been prepared in accordance with the requirements of the Companies Act 2006.
We have audited the financial statements, included within the Annual Report and Accounts 2022 (the 'Annual Report'), which comprise:
• the consolidated balance sheet as at 31 December 2022;
• the consolidated income statement and consolidated statement of comprehensive income for the year then ended;
• the consolidated statement of cash flows for the year then ended;
• the consolidated statement of changes in equity for the year then ended;
• the HSBC Bank plc balance sheet as at 31 December 2022;
• the HSBC Bank plc statement of cash flows for the year then ended;
• the HSBC Bank plc statement of changes in equity for the year then ended; and
• the notes to the financial statements, which include a description of the significant accounting policies.
Certain notes to the financial statements have been presented elsewhere in the Annual Report, rather than in the notes to the financial statements. These are cross-referenced from the financial statements and are identified as '(Audited)'. The relevant disclosures are included in the Risk review section on pages 26 to 93.
Our opinion is consistent with our reporting to the Audit Committee.
Separate opinion in relation to international financial reporting standards adopted pursuant to Regulation (EC) No 1606/2002 as it applies in the European Union
As explained in note 1.1(a) to the financial statements, the group and company, in addition to applying UK-adopted international accounting standards, have also applied international financial reporting standards adopted pursuant to Regulation (EC) No 1606/2002 as it applies in the European Union.
In our opinion, the group and company financial statements have been properly prepared in accordance with international financial reporting standards adopted pursuant to Regulation (EC) No 1606/2002 as it applies in the European Union.
Separate opinion in relation to IFRSs as issued by the IASB
As explained in note 1.1(a) to the financial statements, the group and company, in addition to applying UK-adopted international accounting standards, have also applied international financial reporting standards ('IFRSs') as issued by the International Accounting Standards Board ('IASB').
In our opinion, the group and company financial statements have been properly prepared in accordance with IFRSs as issued by the IASB.
Basis for opinion
We conducted our audit in accordance with International Standards on Auditing (UK) ('ISAs (UK)'), International Standards on Auditing issued by the International Auditing and Assurance Standards Board ('ISAs') and applicable law. Our responsibilities under ISAs (UK) and ISAs are further described in the Auditors' responsibilities for the audit of the financial statements section of our report. We believe that the audit evidence we have obtained is sufficient and appropriate to provide a basis for our opinion.
Independence
We remained independent of the group in accordance with the ethical requirements that are relevant to our audit of the financial statements in the UK, which includes the FRC's Ethical Standard, as applicable to listed public interest entities, and the International Code of Ethics for Professional Accountants (including International Independence Standards) issued by the International Ethics Standards Board for Accountants (IESBA Code), and we have fulfilled our other ethical responsibilities in accordance with these requirements.
To the best of our knowledge and belief, we declare that non-audit services prohibited by either the FRC's Ethical Standard or Article 5(1) of Regulation (EU) No 537/2014 were not provided.
Other than those disclosed in note 6, we have provided no non-audit services to the company or its controlled undertakings in the period under audit.
Our audit approach
Overview
Audit scope
We performed audits of the complete financial information of two components, namely the UK non-ring-fenced bank and HSBC Continental Europe ('HBCE'). For five further components, specific audit procedures were performed over selected significant account balances and financial statement note disclosures.
Key audit matters
• Expected credit losses ('ECL') impairment of loans and advances (group and company)
• Held for sale accounting (group)
• Recognition of deferred tax assets (group); and
• Impairment of investment in subsidiaries (company)
Materiality
• Overall group materiality: £230 million (2021: £218 million) based on 1% of Tier 1 capital.
• Overall company materiality: £133 million (2021: £140 million) based on 1% of Tier 1 capital.
• Performance materiality: £172 million (2021: £164 million) (group) and £99 million (2021: £105 million) (company).
The scope of our audit
As part of designing our audit, we determined materiality and assessed the risks of material misstatement in the financial statements. In particular, we looked at where the directors made subjective judgements, for example in respect of significant accounting estimates that involved making assumptions and considering future events that are inherently uncertain.
Key audit matters
Key audit matters are those matters that, in the auditors' professional judgement, were of most significance in the audit of the financial statements of the current period and include the most significant assessed risks of material misstatement (whether or not due to fraud) identified by the auditors, including those which had the greatest effect on: the overall audit strategy; the allocation of resources in the audit; and directing the efforts of the engagement team. These matters, and any comments we make on the results of our procedures thereon, were addressed in the context of our audit of the financial statements as a whole, and in forming our opinion thereon, and we do not provide a separate opinion on these matters.
This is not a complete list of all risks identified by our audit.
Held for sale accounting (group) is a new key audit matter this year. Valuation of financial instruments (group and company), which was a key audit matter last year, is no longer included because the risk is reduced due to a reduction in the size of the level 3 asset backed securities portfolio, resulting in a lower risk of material misstatement. Otherwise, the key audit matters below are consistent with last year.
Expected credit losses - Impairment of loans and advances (group and company)
| Determining expected credit losses ('ECL') involves management judgement and is subject to a high degree of estimation uncertainty. Management makes various assumptions when estimating ECL. The significant assumptions that we focused on in our audit included those with greater levels of management judgement and for which variations had the most significant impact on ECL. These included assumptions made in determining forward looking economic scenarios and their probability weightings (specifically the central and downside scenarios given these have the most material impact on ECL) and estimating expected cash flows and collateral valuations to assess the ECL of credit impaired wholesale exposures. The level of estimation uncertainty and judgement has remained high during 2022 as a result of the uncertain macroeconomic and geopolitical environment, high levels of inflation and a rising global interest rate environment. This leads to uncertainty around judgements made in determining the severity and probability weighting of macroeconomic variable forecasts across the different economic scenarios used in ECL models, and in the estimation of expected cash flows and collateral valuations on credit impaired stage 3 exposures. Management makes other assumptions which are less judgemental or for which variations have a less significant impact on ECL. These assumptions include: • The methodologies used in quantitative scorecards for determining customer risk ratings ('CRRs'); • Model methodologies themselves; and • Quantitative and qualitative criteria used to assess significant increases in credit risk. |
| We held discussions with the Audit Committee covering governance and controls over ECL. We discussed a number of areas including: • The severity of macroeconomic scenarios, and their related probability weightings; • The valuation of credit impaired exposures, with focus on assumptions made in the recoverability of significant wholesale exposures; and • The disclosures made in relation to ECL. |
| We assessed the design and effectiveness of governance and controls over the estimation of ECL. We observed management's review and challenge in governance forums for (1) the determination of macroeconomic scenarios and their probability weightings and (2) the assessment of ECL for Wholesale exposures, including the assessment of ECL calculated on the largest credit-impaired stage 3 exposures. We also tested controls over: • The input of critical data into source systems and the flow and transformation of critical data from source systems to impairment models and management judgemental adjustments; • Credit reviews that determine CRRs for wholesale customers; • Independent model validation and monitoring; • The calculation and approval of management judgemental adjustments to modelled outcomes; • The identification of credit-impairment triggers; and • The calculation and approval of significant individual impairments relating to the largest wholesale credit-impaired exposures. We involved our economic experts in assessing the significant assumptions made in determining the severity and probability weighting of macroeconomic forecasts. These assessments considered the sensitivity of ECL to variations in the severity and probability weighting of macroeconomic forecasts. We involved our modelling experts in assessing the appropriateness of the significant assumptions and methodologies used for models and independently re-performed the calculations for a sample of those models. We further considered whether the judgements made in selecting the significant assumptions would give rise to indicators of possible management bias. In addition, we performed substantive testing over: • the compliance of ECL methodologies and assumptions with the requirements of IFRS 9; • the appropriateness and application of the quantitative and qualitative criteria used to assess significant increases in credit risk; • a sample of critical data used in the year end ECL calculation; • a sample of CRRs applied to wholesale exposures; and • a sample of calculations made in estimating expected cash flows for certain credit-impaired wholesale exposures. We evaluated and tested the Credit Risk disclosures made in the financial statements. |
| • Measurement uncertainty and sensitivity analysis of ECL estimates, page 47. • Audit Committee Report, page 97. • Credit risk, page 36. • Note 1.2(i) Impairment of amortised cost and FVOCI financial assets, page 129.
|
Recognition of deferred tax assets (group)
| Recognition of deferred tax assets ('DTAs') relies on an assessment of the availability and timing of future deferred tax liabilities and taxable profits against which to recognise accumulated tax losses. Management judgement is required when assessing whether a deferred tax asset should be recognised, particularly when an entity has a history of recent losses and convincing evidence of future taxable profits is required. Judgements include assumptions regarding the forecast cash flows, determination of risk adjustments to such cash flows and the timing of the reversal of temporary differences. Management performed an assessment of the recoverability of deferred tax assets at 31 December 2022 and an additional deferred tax asset of £288 million has been recorded in HBCE. |
| We discussed with the audit committee the key judgements made by management in assessing the recoverability of DTAs. We also discussed the appropriateness of the disclosures made in the annual report. |
| We tested the design and operating effectiveness of controls over deferred tax asset recognition. With the support of our tax specialists we assessed the viability of management's plans to recover deferred tax assets. We tested key inputs into the deferred tax recognition model, including forecast cash flows to approved plans and their consistency with other judgements. We challenged management on their methodology and underlying assumptions in arriving at their judgements, including in relation to availability of convincing other evidence of future taxable profits and determination of risk adjustments applied to those forecast taxable profits. In assessing these judgements we considered the historic taxable profits and losses and the evidence provided to support the judgement that the criteria for recognition had been reached. We challenged the achievability of management's forecast taxable profits, considering the achievement of historic forecasts and assessing the sensitivity of forecasts to reasonable variations in significant assumptions. We also evaluated assumptions made over the future reversal of deferred tax assets and liabilities. We evaluated and tested the disclosures made in the financial statements |
| • Audit Committee Report, page 97. • Note 1.2(l) Tax, page 133 • Note 7: Tax, page 143 |
Held for sale accounting (group)
| The group has agreements to sell a number of businesses as part of executing its strategy. This has resulted in £21.2 billion of assets and £24.7 billion of liabilities being classified as held for sale as at 31 December 2022, in relation to businesses in France, Russia and Greece. In addition to the assets and liabilities classified as held for sale, a pre-tax loss of £1.7 billion has also been recognised in 2022 in relation to the sale of the business in France. For the assets and liabilities to be classified as held for sale, the sale needs to be considered highly probable and expected to complete within 12 months of the date of classification. We focused our audit on the areas with greater levels of management judgement relating to the highly probable assessment including the expected timing of completion, the appropriateness of disclosures relating to the highly probable assessment and the loss recognised in relation to the sale of business in France. |
| We discussed with the Audit Committee the judgements made by management in determining if the highly probable threshold were met as at 31 December 2022. We also discussed the appropriateness of the disclosure made in the Annual Report which explained how management had concluded that transactions met the highly probable threshold as at 31 December 2022. |
| We tested governance and controls in place over the management process to determine if the highly probable threshold had been met on assets and liabilities classified as held for sale. We assessed the key judgments made by management to determine whether the highly probable threshold was met as at 31 December 2022, including their assessment of remaining actions to complete the transaction, any regulatory requirements that need to be met, and the likelihood and expected timing of the transactions being approved by relevant regulators and shareholders. We also tested the completeness and accuracy of the assets and liabilities that were classified as held for sale and the loss on sale recognised in relation to the French business. We evaluated and tested the disclosures made in the Annual Report in relation to assets and liabilities classified as held for sale. |
| • Audit Committee Report, page 97. • Note 1.2(o): Critical accounting estimates and judgements, page 134. • Note 34: Assets held for sale and liabilities of disposal groups held for sale, page 186. |
Impairment of investment in subsidiaries (company)
| Management reviewed investments in subsidiaries for indicators of impairment or reversal of impairment previously recorded as at 31 December 2022. Where indicators were identified management estimated the recoverable amount using a value in use ('VIU') model. Management's assessment resulted in a partial reversal of an impairment charge of £2 billion in relation to the investment in HBCE. This resulted in investment in subsidiaries of £10.6 billion at 31 December 2022. The methodology used to estimate the recoverable amount is dependent on various assumptions, both short term and long term in nature. These assumptions, which are subject to estimation uncertainty, are derived from a combination of management's judgement, experts engaged by management and market data. The significant assumptions that we focused our audit on were those with greater levels of management judgement and for which variations had the most significant impact on the recoverable amount. Specifically, these included forecast cash flows for 2023 to 2027, regulatory capital requirements, long term growth rates and discount rates. |
| We discussed the partial reversal of the impairment charge for HBCE, the appropriateness of methodologies used and significant assumptions with the audit committee, giving consideration to the macroeconomic outlook and HSBC's strategy. We considered reasonable possible alternatives for significant assumptions. |
| We tested controls in place over significant assumptions and the model used to determine the recoverable amounts. We assessed the appropriateness of the methodology used, and tested the mathematical accuracy of the calculations, to estimate the recoverable amounts. In respect of the significant assumptions, our testing included the following: • Challenging the achievability of management's business plan and the prospects for HSBC's businesses, as well as considering the achievement of historic forecasts; • Obtaining and evaluating evidence relating to significant assumptions, from a combination of historic experience and external market and other financial information; • Assessing whether the cash flows included in the model were in accordance with the relevant accounting standard; • Assessing the sensitivity of the VIU to reasonable variations in significant assumptions, both individually and in aggregate; and • Determining a reasonable range for the discount rate used within the model, with the assistance of our valuation experts, and comparing it to the discount rate used by management. We evaluated and tested the disclosures made in the financial statements in relation to investment in subsidiaries. |
| • Audit Committee Report, page 97. • Note 1.2(a) Consolidation and related policies, page 126. • Note 18: Investment in subsidiaries, page 166. |
How we tailored the audit scope
We tailored the scope of our audit to ensure that we performed enough work to be able to give an opinion on the financial statements as a whole, taking into account the structure of the group and the company, the accounting processes and controls, and the industry in which they operate.
The risks that HSBC faces are diverse, with the interdependencies between them being numerous and complex. In performing our risk assessment we engaged with a number of stakeholders to ensure we appropriately understood and considered these risks and their interrelationships. This included stakeholders within HSBC and our own experts within PwC. This engagement covered external factors across the geopolitical, macroeconomic and regulatory and accounting landscape, the impact of climate change risk as well as the internal environment at HSBC, driven by strategy and transformation.
We evaluated and challenged management's assessment of the impact of climate change risk including their conclusion that there is no material impact on the financial statements. In making this evaluation we considered management's use of stress testing and scenario analysis to arrive at the conclusion that there is no material impact on the financial statements. We considered management's assessment on the areas in the financial statements most likely to be impacted by climate risk, including: the impact on ECL on loans and advances to customers, for both physical and transition risk; the forecast cash flows from management's five year business plan and long term growth rates used in estimating recoverable amounts as part of impairment assessments of investments in subsidiaries; the impact of climate related terms on the solely payments of principal and interest test for classification and measurement of loans and advances to customers; and climate risks relating to contingent liabilities as HSBC faces increased reputational, legal and regulatory risk as it progresses towards its climate ambition.
Using our risk assessment, we tailored the scope of our audit to ensure that we performed enough work to be able to give an opinion on the financial statements as a whole, taking into account the structure of the group and the company, the accounting processes and controls, and the industry in which they operate.
HSBC Bank plc is structured into five divisions being Markets & Securities Services, Global Banking, GBM Other, Commercial Banking and Wealth and Personal Banking, which are supported by a Corporate Centre. The divisions operate across a number of operations, subsidiary entities and branches ('components') throughout Europe. Within the group's main consolidation and financial reporting system, the consolidated financial statements are an aggregation of the components. Each component submits their financial information to the group in the form of a consolidation pack.
In establishing the overall approach to the group and company audit, we scoped using the balances included in the consolidation pack. We determined the type of work that needed to be performed over the components by us, as the group engagement team, or auditors within PwC UK and from other PwC network firms operating under our instruction ('component auditors').
As a result of our scoping, for the group we determined that audits of the complete financial information of the UK non-ring-fenced bank ('UK NRFB') and HBCE were necessary, owing to their financial significance. We instructed component auditors, PwC UK and PwC France to perform the audits of these components. Our interactions with component auditors included regular communication throughout the audit, including the issuance of instructions, a review of working papers relating to the key audit matters and formal clearance meetings. The group audit engagement partner was also the partner on the audit of the UK NRFB significant component.
We then considered the significance of other components in relation to primary statement account balances and note disclosures. In doing this we also considered the presence of any significant audit risks and other qualitative factors (including history of misstatements through fraud or error). For five components, specific audit procedures were performed over selected significant account balances. For the remainder, the risk of material misstatement was mitigated through group audit procedures including testing of entity level controls and group and company level analytical review procedures.
Certain group-level account balances were audited by the group engagement team.
Materiality
The scope of our audit was influenced by our application of materiality. We set certain quantitative thresholds for materiality. These, together with qualitative considerations, helped us to determine the scope of our audit and the nature, timing and extent of our audit procedures on the individual financial statement line items and disclosures and in evaluating the effect of misstatements, both individually and in aggregate on the financial statements as a whole.
Based on our professional judgement, we determined materiality for the financial statements as a whole as follows:
| Overall materiality |
£230 million (2021: £218 million). |
£133 million (2021: £140 million). |
| How we determined it |
1% of Tier 1 capital |
1% of Tier 1 capital |
| Rationale for benchmark applied |
Tier 1 capital is used as a benchmark as it is considered to be a key driver of HSBC Bank plc's decision making process and has been a primary focus for regulators. |
Tier 1 capital is used as a benchmark as it is considered to be a key driver of HSBC Bank plc's decision making process and has been a primary focus for regulators. |
Tier 1 capital was also used as the benchmark in the prior year. The basis for determining materiality was re-evaluated and we considered other benchmarks, such as profit before tax. Tier 1 capital is a common benchmark for wholly owned banking subsidiaries, because of the focus on financial stability. Tier 1 capital was determined to continue to be an appropriate benchmark given the importance of this metric to the HSBC Bank plc decision making process and to principal users of the financial statements, including the ultimate holding company HSBC Holdings plc.
For each component in the scope of our group audit, we allocated a materiality that is less than our overall group materiality. The range of materiality allocated across components was £8 million to £230 million. Certain components were audited to a local statutory audit materiality that was also less than our overall group materiality.
We use performance materiality to reduce to an appropriately low level the probability that the aggregate of uncorrected and undetected misstatements exceeds overall materiality. Specifically, we use performance materiality in determining the scope of our audit and the nature and extent of our testing of account balances, classes of transactions and disclosures, for example in determining sample sizes. Our performance materiality was 75% (2021: 75%) of overall materiality, amounting to £172 million (2021: £164 million) for the group financial statements and £99 million (2021: £105 million)for the company financial statements.
In determining the performance materiality, we considered a number of factors - the history of misstatements, risk assessment and aggregation risk and the effectiveness of controls - and concluded that an amount at the upper end of our normal range was appropriate.
We agreed with the Audit Committee that we would report to them misstatements identified during our audit above £11 million (group audit) (2021: £11 million) and £6 million (company audit) (2021: £7 million) as well as misstatements below those amounts that, in our view, warranted reporting for qualitative reasons.
Conclusions relating to going concern
Our evaluation of the directors' assessment of the group's and the company's ability to continue to adopt the going concern basis of accounting included:
• Performing a risk assessment to identify factors that could impact the going concern basis of accounting, including both internal risks (i.e., strategy execution) and external risks (i.e., macroeconomic conditions).
• Understanding and evaluating the group and company's financial forecasts and stress testing of liquidity and regulatory capital, including the severity of the stress scenarios that were used.
• Understanding and evaluating credit agency ratings and actions.
• Reading and evaluating the adequacy of the disclosures made in the financial statements in relation to going concern.
Based on the work we have performed, we have not identified any material uncertainties relating to events or conditions that, individually or collectively, may cast significant doubt on the group's and the company's ability to continue as a going concern for a period of at least twelve months from when the financial statements are authorised for issue.
In auditing the financial statements, we have concluded that the directors' use of the going concern basis of accounting in the preparation of the financial statements is appropriate.
However, because not all future events or conditions can be predicted, this conclusion is not a guarantee as to the group's and the company's ability to continue as a going concern.
Our responsibilities and the responsibilities of the directors with respect to going concern are described in the relevant sections of this report.
Reporting on other information
The other information comprises all of the information in the Annual Report other than the financial statements and our auditors' report thereon. The directors are responsible for the other information. Our opinion on the financial statements does not cover the other information and, accordingly, we do not express an audit opinion or, except to the extent otherwise explicitly stated in this report, any form of assurance thereon.
In connection with our audit of the financial statements, our responsibility is to read the other information and, in doing so, consider whether the other information is materially inconsistent with the financial statements or our knowledge obtained in the audit, or otherwise appears to be materially misstated. If we identify an apparent material inconsistency or material misstatement, we are required to perform procedures to conclude whether there is a material misstatement of the financial statements or a material misstatement of the other information. If, based on the work we have performed, we conclude that there is a material misstatement of this other information, we are required to report that fact. We have nothing to report based on these responsibilities.
With respect to the Strategic report and Report of the Directors, we also considered whether the disclosures required by the UK Companies Act 2006 have been included.
Based on our work undertaken in the course of the audit, the Companies Act 2006 requires us also to report certain opinions and matters as described below.
Strategic Report and Report of the Directors
In our opinion, based on the work undertaken in the course of the audit, the information given in the Strategic report and Report of the Directors for the year ended 31 December 2022 is consistent with the financial statements and has been prepared in accordance with applicable legal requirements.
In light of the knowledge and understanding of the group and company and their environment obtained in the course of the audit, we did not identify any material misstatements in the Strategic report and Report of the Directors.
Responsibilities for the financial statements and the audit
Responsibilities of the directors for the financial statements
As explained more fully in the Statement of directors' responsibilities in respect of the financial statements, the directors are responsible for the preparation of the financial statements in accordance with the applicable framework and for being satisfied that they give a true and fair view. The directors are also responsible for such internal control as they determine is necessary to enable the preparation of financial statements that are free from material misstatement, whether due to fraud or error.
In preparing the financial statements, the directors are responsible for assessing the group's and the company's ability to continue as a going concern, disclosing, as applicable, matters related to going concern and using the going concern basis of accounting unless the directors either intend to liquidate the group or the company or to cease operations, or have no realistic alternative but to do so.
Auditors' responsibilities for the audit of the financial statements
Our objectives are to obtain reasonable assurance about whether the financial statements as a whole are free from material misstatement, whether due to fraud or error, and to issue an auditors' report that includes our opinion. Reasonable assurance is a high level of assurance, but is not a guarantee that an audit conducted in accordance with ISAs (UK) and ISAs will always detect a material misstatement when it exists. Misstatements can arise from fraud or error and are considered material if, individually or in the aggregate, they could reasonably be expected to influence the economic decisions of users taken on the basis of these financial statements.
Irregularities, including fraud, are instances of non-compliance with laws and regulations. We design procedures in line with our responsibilities, outlined above, to detect material misstatements in respect of irregularities, including fraud. The extent to which our procedures are capable of detecting irregularities, including fraud, is detailed below.
Based on our understanding of the group and industry, we identified that the principal risks of non-compliance with laws and regulations related to Financial Conduct Authority's ('FCA') regulations, the Prudential Regulation Authority's ('PRA') regulations, UK tax legislation and equivalent local laws and regulations applicable to other countries in which the company operates, and we considered the extent to which non-compliance might have a material effect on the financial statements.
We also considered those laws and regulations that have a direct impact on the financial statements such as the Companies Act 2006. We evaluated management's incentives and opportunities for fraudulent manipulation of the financial statements (including the risk of override of controls), and determined that the principal risks were related to posting inappropriate journal entries to increase revenue or reduce costs, creation of fictitious transactions to hide losses or to improve financial performance, and management bias in accounting estimates. The group engagement team shared this risk assessment with the component auditors so that they could include appropriate audit procedures in response to such risks in their work. Audit procedures performed by the group engagement team and/or component auditors included:
• Review of correspondence with and reports to the regulators, including the PRA and FCA;
• Review of reporting to the Audit Committee and Risk Committee in respect of compliance and legal matters;
• Review of a sample of legal correspondence with legal advisors;
• Enquiries of management and review of internal audit reports in so far as they related to the financial statements;
• Obtaining legal confirmations from legal advisors relating to material litigation and compliance matters;
• Challenging assumptions and judgements made by management in their significant accounting estimates, in particular in relation to the determination of fair value for certain financial instruments, the determination of expected credit losses, impairment assessments of investments in subsidiaries and recognition of deferred tax assets;
• Obtaining confirmations from third parties to confirm the existence of a sample of transactions and balances; and
• Identifying and testing journal entries meeting specific fraud criteria, including those posted with certain descriptions, posted and approved by the same individual, backdated journals or posted by infrequent and unexpected users.
There are inherent limitations in the audit procedures described above. We are less likely to become aware of instances of non-compliance with laws and regulations that are not closely related to events and transactions reflected in the financial statements. Also, the risk of not detecting a material misstatement due to fraud is higher than the risk of not detecting one resulting from error, as fraud may involve deliberate concealment by, for example, forgery or intentional misrepresentations, or through collusion.
Our audit testing might include testing complete populations of certain transactions and balances, possibly using data auditing techniques. However, it typically involves selecting a limited number of items for testing, rather than testing complete populations. We will often seek to target particular items for testing based on their size or risk characteristics. In other cases, we will use audit sampling to enable us to draw a conclusion about the population from which the sample is selected.
A further description of our responsibilities for the audit of the financial statements in accordance with ISAs (UK) is located on the FRC's website at: www.frc.org.uk/auditorsresponsibilities. This description forms part of our auditors' report.
As part of an audit in accordance with ISAs, we exercise professional judgement and maintain professional scepticism throughout the audit. We also:
• Identify and assess the risks of material misstatement of the consolidated financial statements, whether due to fraud or error, design and perform audit procedures responsive to those risks, and obtain audit evidence that is sufficient and appropriate to provide a basis for our opinion. The risk of not detecting a material misstatement resulting from fraud is higher than for one resulting from error, as fraud may involve collusion, forgery, intentional omissions, misrepresentations, or the override of internal control.
• Obtain an understanding of internal control relevant to the audit in order to design audit procedures that are appropriate in the circumstances, but not for the purpose of expressing an opinion on the effectiveness of the group's and company's internal control.
• Evaluate the appropriateness of accounting policies used and the reasonableness of accounting estimates and related disclosures made by management.
• Conclude on the appropriateness of management's use of the going concern basis of accounting and, based on the audit evidence obtained, whether a material uncertainty exists related to events or conditions that may cast significant doubt on the group's and company's ability to continue as a going concern. If we conclude that a material uncertainty exists, we are required to draw attention in our auditor's report to the related disclosures in the consolidated financial statements or, if such disclosures are inadequate, to modify our opinion. Our conclusions are based on the audit evidence obtained up to the date of our auditor's report. However, future events or conditions may cause the group to cease to continue as a going concern.
• Evaluate the overall presentation, structure and content of the consolidated financial statements, including the disclosures, and whether the consolidated financial statements represent the underlying transactions and events in a manner that achieves fair presentation.
• Obtain sufficient appropriate audit evidence regarding the financial information of the entities or business activities within the group and company to express an opinion on the consolidated financial statements. We are responsible for the direction, supervision and performance of the group and company audit. We remain solely responsible for our audit opinion.
We communicate with those charged with governance regarding, among other matters, the planned scope and timing of the audit and significant audit findings, including any significant deficiencies in internal control that we identify during our audit.
We also provide those charged with governance with a statement that we have complied with relevant ethical requirements regarding independence, and to communicate with them all relationships and other matters that may reasonably be thought to bear on our independence, and where applicable, actions taken to eliminate threats or safeguards applied.
From the matters communicated with those charged with governance, we determine those matters that were of most significance in the audit of the consolidated financial statements of the current period and are therefore the key audit matters. We describe these matters in our auditor's report unless law or regulation precludes public disclosure about the matter or when, in extremely rare circumstances, we determine that a matter should not be communicated in our report because the adverse consequences of doing so would reasonably be expected to outweigh the public interest benefits of such communication.
Use of this report
This report, including the opinions, has been prepared for and only for the company's members as a body in accordance with Chapter 3 of Part 16 of the Companies Act 2006 and for no other purpose. We do not, in giving these opinions, accept or assume responsibility for any other purpose or to any other person to whom this report is shown or into whose hands it may come save where expressly agreed by our prior consent in writing.
| Other required reporting |
Companies Act 2006 exception reporting
Under the Companies Act 2006 we are required to report to you if, in our opinion:
• we have not obtained all the information and explanations we require for our audit; or
• adequate accounting records have not been kept by the company, or returns adequate for our audit have not been received from branches not visited by us; or
• certain disclosures of directors' remuneration specified by law are not made; or
• the company financial statements are not in agreement with the accounting records and returns.
We have no exceptions to report arising from this responsibility
Appointment
Following the recommendation of the Audit Committee, we were appointed by the directors on 31 March 2015 to audit the financial statements for the year ended 31 December 2015 and subsequent financial periods. The period of total uninterrupted engagement is eight years, covering the years ended 31 December 2015 to 31 December 2022.
Other matter
As required by the Financial Conduct Authority Disclosure Guidance and Transparency Rule 4.1.14R, these financial statements form part of the ESEF-prepared annual financial report filed on the National Storage Mechanism of the Financial Conduct Authority in accordance with the ESEF Regulatory Technical Standard ('ESEF RTS'). This auditors' report provides no assurance over whether the annual financial report has been prepared using the single electronic format specified in the ESEF RTS.
Lawrence Wilkinson
(Senior Statutory Auditor)
for and on behalf of PricewaterhouseCoopers LLP
Chartered Accountants and Statutory Auditors
London
20 February 2023
RNS may use your IP address to confirm compliance with the terms and conditions, to analyse how you engage with the information contained in this communication, and to share such analysis on an anonymised basis with others as part of our commercial services. For further information about how RNS and the London Stock Exchange use the personal data you provide us, please see our Privacy Policy.