The information contained within this announcement was deemed by the Company to constitute inside information as stipulated under the UK Market Abuse Regulation.
4 November 2025
EnSilica plc
("EnSilica", the "Company" or the "Group")
Audited Results for the Year Ended 31 May 2025
Robust New Contract Conversion and Strong Supply Growth
EnSilica delivers some of the most complex semiconductor engineering projects in the industry
EnSilica (AIM: ENSI), a leading chip maker of mixed-signal ASICs (Application Specific Integrated Circuits), announces its audited results for the year ended 31 May 2025 ("FY 25","FY 2025" or the "Year").
Financial Highlights
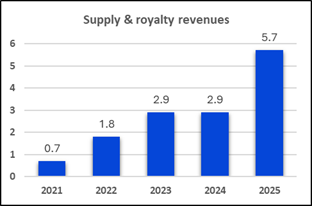
· Full year revenues of £18.2 million (FY 24: £25.3 million) were lower than prior year but chip supply revenues doubled to £5.7 million
· Gross profit margin improved from 36% to 40% reflecting the change in business mix
· Customer expected credit loss allowance of £1.8 million required
· Breakeven EBITDA* achieved (excluding the allowance for credit losses, an EBITDA profit of £1.8 million was achieved) (FY 24: £1.7 million profit)
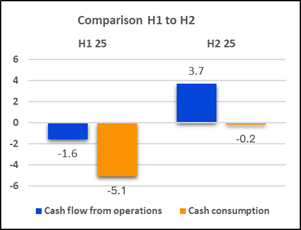
· Improving operating cash generation profile with net operating cash flow of £2.1 million generated (FY 24: £4.3 million) of which £3.7 million was generated in the second half of 2025 ("H2 FY 25") after an initial outflow in H1 FY 25
· Cash and cash equivalents of £2.0 million (FY 24: £5.2 million post fundraise)
· Further investment of £5.8 million in intellectual property assets
* The EBITDA outturn for FY 25 of £nil million is £1.3 million better than the EBITDA loss announced in our trading update on 16 October 2025 after a subsequent technical consultation resulted in the research and development ("RDEC") tax credit from the new HMRC merged scheme being required to be reclassified as Other income in line with technical accounting guidance.
STRONG CONTRACT MOMENTUM IN THE PERIOD
· New supply-only contract awarded valued at $7 million for Edge Artificial Intelligence (AI) processing Chip with further potential supply revenue of more than $50 million over the first five years of production.
· Major Telecommunications ASIC and Supply contract awarded with a leading European telecommunications equipment provider introducing key differentiating features for the client's next-generation telecommunication infrastructure products valued over $30 million over a ten-year period.
· First Production order for Industrial ASIC awarded by a leading European Industrial Original Equipment Manufacturer (OEM), a key component in their factory automation controller systems. Production revenues of $30 million are expected over a seven-year period.
· Design & Supply contract awarded for a controller ASIC for automotive and industrial motorised actuators for a leading supplier to most automotive and industrial original equipment manufacturers (OEMs). Value is projected to exceed $31 million over 7 years.
· New Design & Supply contract awarded for a precision Timing Controller ASIC to be used in high-value industrial test equipment, total value projected to exceed $30 million over 10 years.
· Awarded £10.38 million UK Space Agency funding over the next 3 years for a development project under its Connectivity in Low Earth Orbit (C-Leo) programme.
· Awarded a $18 million Design & Supply contract by a leading European based supplier of electromechanical products for an Arm-based mixed signal sensor interface ASIC. Total contract value is estimated to exceed $18 million over 7 years.
POST YEAR-END CONTRACTS
· June 25 - First royalty payments triggered, and an extended royalty agreement signed with an existing satellite service provider. The total value of the expanded agreement is estimated to be worth c. $28 million over the next 10 years (previously estimated to be $15 million over 5 years).
· August 25 - New EU Mixed signal design centre established in Budapest, Hungary
OUTLOOK
· EnSilica continues to build a strong pipeline and order book, which underpins our ongoing confidence in the business, and we entered FY 26 with strong orders for chip supply and NRE and commercial momentum
· The Company continues to invest in R&D initiatives, such as post quantum cryptography ("PQC") and satellite communication technology, with continued support from organisations such as the UK Space Agency and Innovate UK
· Despite reporting an operating loss in FY 25, the Board remains confident in the Company's ability to return to profitability, citing its success in winning new customers, including six new development and supply agreements and two design agreements with a lifetime value exceeding $100 million, coupled with its ability to control capital expenditure and operational spending
· The Group remains well progressed in its mission of being Europe's premier application specific chip supplier, and its core focus on innovation, quality, and reliability will enable this goal
· The Group is approaching the phase where supply revenues support future investment & overhead before non-cash charges, and we are targeting to become cash flow positive during 2026
· Our ambitions for the medium term (3 to 5 years) are for annual revenues in excess of £60m and longer term (6 to 10 years), our order book and opportunities give us extended aspirations of £100m of revenues
Ian Lankshear, Chief Executive Officer of EnSilica, commented:
"The last 12 months have been a critically important period in our strategic development as we continue to expand our supply-generated income streams, an important benchmark to our long-term success. In addition, we continue to make strong operational progress across our key end markets of industrial, automotive, and space sectors, with several chip developments now advancing through the design phase as planned.
Our pipeline continues to strengthen, with the timing controller ASIC, as announced on 6 December 2024, successfully completing the test-chip tape-out in August 2025. A further five tape-outs are scheduled for completion before the end of FY 26, relating to other customer products currently in design, reflecting very strong execution across EnSilica's development pipeline.
I remain confident in our ability to further capitalise on this growing market opportunity, supported by an ongoing need for a resilient, trusted European supply chain, alongside our expanding IP portfolio and strong market reputation."
Investor Presentation
An online presentation of the annual results will be held on Wednesday, 5 November 2025 at 2.00 p.m. GMT. The presentation will be hosted on the Investor Meet Company ("IMC") platform. Questions can be submitted pre-event via the IMC dashboard up until 9.00 a.m. GMT the day before the meeting or at any time during the live presentation.
Investors can sign up to IMC for free and add EnSilica to attend the webcast via:
https://www.investormeetcompany.com/ensilica-plc/register-investor
Annual Report and AGM
The Company's annual report and accounts together with notice of the annual general meeting ("AGM") will be posted to shareholders this week and will be made available on the Company's website.
The Annual General Meeting will be held on 27 November 2025 at 10.00 a.m. GMT at Courtyard by Marriott Oxford South, 6 Milton Gate, Milton, Abingdon, Oxfordshire OX14 4FP.
For further information please contact:
| EnSilica plc Ian Lankshear, Chief Executive Officer Kristoff Rademan, Chief Financial Officer |
via Vigo Consulting +44 (0)20 7390 0233 |
|
Allenby Capital Limited (Nominated Adviser & Joint Broker) Jeremy Porter / Vivek Bhardwaj (Corporate Finance) Joscelin Pinnington / Tony Quirke (Sales & Corporate Broking)
|
+44 (0)20 3328 5656 |
| Panmure Liberum Limited (Joint Broker) Edward Mansfield / Will King |
+44 (0)20 3100 2000
|
|
Vigo Consulting (Investor & Financial Public Relations) Jeremy Garcia / Anna Stacey |
+44 (0)20 7390 0233 ensilica@vigoconsulting.com |
The person responsible for arranging release of this announcement on behalf of the Company is Kristoff Rademan, Chief Financial Officer.
About EnSilica plc
EnSilica is a leading fabless design house focused on custom ASIC design and supply for OEMs and system houses, as well as IC design services for companies with their own design teams. The company has world-class expertise in supplying custom RF, mmWave, mixed signal and digital ICs to its international customers in the automotive, industrial, healthcare and communications markets. The company also offers a broad portfolio of core IP covering cryptography, radar, and communications systems. EnSilica has a track record in delivering high quality solutions to demanding industry standards. The company is headquartered near Oxford, UK and has design centres across the UK and in Bangalore, India and Porto Alegre and Campinas, Brazil.
Chair's statement
I am delighted to present EnSilica's full year results for the financial year ended 31 May 2025.
The business has continued to execute on its stated growth strategy, as highlighted in the substantial growth of our chip supply revenues alongside the Company's ongoing success in securing a significant number of new orders for chip supply in the medium term.
Pleasingly, we continue to have good visibility on significant supply revenues in the next three to four years and are now rapidly approaching the culmination of our strategy to reposition EnSilica as Europe's premier application specific chip maker, a journey we began in 2016.
Our strategic progress aside, our financial progress was slowed by customer driven delays across a number of sizable projects, however we continue to benefit from the positive impact of additional new secured contracts, which ultimately benefitted the Group in H2 2025 and also gradually improved our cash position. This positive impact has continued into financial year 2026.
Our contract momentum accelerated during the Period, with this progress reflecting positively on the strategy which we have adopted, recognising the efforts of all our team members globally.
The demand for our services continues to expand as our operational footprint and broader market reputation grows globally. This is particularly true in the satellite communications market space where we have made significant progress, driven by our own inhouse expertise and intellectual property stack, which is attracting interest from a range of customers. In addition, the recent shift from policy makers in the US has created an opportunity to develop our business across our European locations. This shift has further helped the business in becoming a leading European based basic fabless manufacturer.
Our growth in new projects secured and the initial success in developing the satellite opportunity has required us to seek out an ever more geographically diverse labour force, resulting in a c.67% increase in headcount to over 200 employees across our business at the time of IPO. The search for talented staff remains a key focus as does the recruitment and development of talented graduates.
Inevitably, our ever-expanding order book and the concomitant increase in engineering staff and support staff makes the management of working capital a key focus at all times. During the Period, we had the benefit of our new CFO, Kristoff Rademan, who commenced in May 2024. This has been a key hire for the business.
There is a real sense now that we are beginning to realise our potential across EnSilica's chosen key growth markets and I would like to thank our shareholders for their patience during this part of our development cycle.
During FY 2026, we are looking forward to maintaining our strong new business momentum, which further supports our journey to cash flow maturity, as our supply revenues grow further and feed through into an ever-improving cash position.
Mark Hodgkins
Executive Chair
4 November 2025
Chief Executive's Review
We have witnessed a substantial evolution in our operational approach with an enhanced rate of securing new contracts and a robust expansion in our supply-generated income. The continued trend for a resilient trusted European supply chain remains a key driving factor, along with the expansion of our IP portfolio, with a strong market reputation.
Across the last 12 months, we have delivered ongoing momentum across our business model, generating significant new contract conversions and more importantly strong growth in our chip supply revenues. While our overall revenue growth frustratingly reduced in the Period, due to delays in NRE revenue recognition relating to two sizable contracts, the business continues to strengthen.
The Group delivered revenues of £18.2 million across FY 25 (FY 2024: £25.3 million), primarily due to the non-recurrence of a large space communications tape-out in the prior year and lower ASIC development revenues as older agreements moved towards completion. However, supply revenues increased by a staggering 97% to £5.7 million, demonstrating significant progress towards our vision of becoming a highly profitable 'fabless' semiconductor business.
EBITDA decreased to £nil million (FY 2024: profit of £1.7 million), primarily reflecting the £1.8 million non-cash expected credit loss allowance relating to the delayed SIAE project, a risk that has previously been flagged, and the required reclassification of the RDEC tax credit to Other income. Excluding the SIAE one-off item, EnSilica would have reported a positive EBITDA of approximately £1.8 million for the year, consistent with earlier expectations. The business generated £2.1 million of net cash from operations, supported by a £1.2 million equity raise, £1.0 million from refinancing existing loans, and £1.2 million received from HMRC as a Research and Development Expenditure Credit ("RDEC").
FY 25 has also seen the business accelerate its evolution to becoming a key international "fabless" semiconductor supplier of ASICs across the industrial, automotive, communications and healthcare verticals.
Our strong IP, design re-use strategy, and increasing reputation across our key markets continues to position the Company for strong future growth.
Ensilica's Business Model and Strategic Evolution
EnSilica operates a fabless semiconductor model, providing an end-to-end solution encompassing the development, manufacturing and supply of Integrated Circuits (ICs). This model allows the business to focus on the value-add of customising chips for our customers while outsourcing the capital-intensive fabrication process.
EnSilica typically secures upfront payment for Non-Recurring Engineering (NRE) costs, and will often co-invest in chip development, anticipating high-margin supply or royalty revenues once ASICs reach the production stage.
This strategy embeds EnSilica deeper into the electronics value chain and has historically proven successful for leading fabless companies globally.
In FY 2024, we introduced a "supply only" model, leveraging our strengthened relationships with key foundries and outsourcing partners.
Under this model, EnSilica manages foundry interfaces, including the critical tape-out process, supplying wafers or packaged chips back to customers who primarily handle the chip design. This initiative is designed to enhance production margins through increased wafer volumes and solidify our position within the semiconductor supply chain, and more importantly validate our model by securing revenue and profit growth in the medium term.
Our core growth strategy remains steadfast:
· Leveraging our strong Intellectual Property (IP) and know-how within automotive, industrial, healthcare, and satellite connectivity applications for mixed signal ASICs. Our post quantum cryptography (PQC) accelerator IP addresses all of these markets.
· Scaling our Fabless ASIC Model to fully exploit revenue opportunities from design and supply engagements.
· Capitalising on the growing requirement for custom Edge AI and enhanced Cyber Security, leading to the re-design of many industrial, automotive, and communication chips. We have proactively incorporated PQC accelerators into our eSi-Crypto range of hardware IP to address future quantum computing threats.
· Developing Applications Specific Standard Parts (ASSPs) driven by customer demand and leveraging funding sources, with five significant platforms already at the device evaluation stage, four of which have been funded by the European Space Agency, the UK Space Agency and Innovate UK.
Market Opportunities and our Strategic Focus
The global semiconductor market continues its rapid expansion, with projections indicating significant growth, reaching potentially $1 trillion in sales by 2030.
EnSilica remains strategically focused on four principal high-growth markets where our expertise and IP are in high demand high demand. The ASIC market is approximately 5% of the total market and is concentrated on emerging markets or ones undergoing key technology changes.
· Satellite Communication Sector: This sector, particularly internet broadband using Low Earth Orbit (LEO) satellites and 5G Non-Terrestrial Networks (NTN), is undergoing transformative changes. EnSilica's key IP and expertise in mmWave RF and beamforming technologies, coupled with funded projects for next-generation user terminals, ideally positions EnSilica to capitalise on this opportunity. This was endorsed by the UK Space Agency award of £10 million of funding to accelerate this development. In 2021, we were selected by AST SpaceMobile to develop next-generation ASICs for their space-based cellular broadband network, highlighting our expertise in state-of-the-art performance and power efficiency with one of the emerging LEO constellation providers.
· Industrial Sector: Valued at $78.57 billion in 2023 and projected to reach $208.13 billion by 2031, this sector increasingly demands advanced semiconductor solutions for automation, efficiency, and connectivity. Our collaboration with Siemens, the leading European industrial OEM, underscores our position as a leading ASIC supplier for high-quality, high-integrity digital and mixed-signal ASICs.
· Automotive Sector: Driven by innovation, the shift to electric vehicles (EVs), and advancements in Advanced Driver Assistance Systems and autonomous driving, this market is expected to reach $130 billion by 2030. A standard hybrid electric car contains approximately 3,500 semiconductor chips. Our mixed signal and digital expertise design flow meets the sector's stringent quality and functional safety requirements.
· Healthcare Wearables Sector: This market is experiencing substantial growth, with advancements in AI enabling medical condition detection through various monitoring devices. The market for semiconductors in healthcare is projected to reach $161.3 billion by 2031. EnSilica has developed key IP, including a vital sign sensors IC with accurate sensor interfaces and very low power consumption. Due to the longer time to market on these, often certified products, management has focused on the other markets more recently. Our aim however is to increase focus by leveraging grant funding in collaboration with a lead customer.
Key Achievements and Contract Wins Since 31 May 2024
FY 2025 was a strong year for new contract conversions and supply growth. We successfully secured six new ASIC development and supply agreements through competitive tendering processes. This achievement is a clear indication that we are establishing our position in our markets, through the quality of our customers and the reliability of our delivery. Our enhanced status is securing both revenue and profit growth in the medium-term.
Notable contract wins and milestones include:
· A second industrial automation ASIC design and supply contract with Siemens.
· Awarded a £4.3 million security controller chip development under a UK Contract for Innovation from the Department for Science, Innovation and Technology targeting Critical National Infrastructure (CNI) application.
· A timing control ASIC design and supply contract valued at over $30 million.
· A Photonics Controller ASIC design and supply contract with Oriole Networks.
· An automotive and industrial ASIC design and supply contract worth over $31 million over seven years.
· A design and supply contract for an Arm based automotive and industrial controller worth $18 million over seven years.
· Awarded a significant supply-only contract for an edge AI processing chip, valued at $7 million NRE, with potential supply revenue exceeding $50 million over the first five years of production.
· Awarded substantial funding of £10.38 million from the UK Space Agency for a development project focused on creating next-generation semiconductor chips for mass-market satellite broadband user terminals.
· Secured our first royalty payment and an extended royalty agreement with an existing satellite service provider customer, now estimated to be worth approximately $28 million over the next 10 years (previously $15 million over 5 years).
· Awarded a European Space Agency (ESA) contract to design a crucial silicon component for advanced, jamming resilient multi-band Global Navigation Satellite System (GNSS) capabilities, bolstering security for critical infrastructure.
· Introduced two new Ku-band beamformer integrated circuits, enhancing the satcoms user terminal portfolio with low power consumption and high performance for next-generation electronically steered antennas.
Operational Developments and our People
· Our team increased by 168 to 179 average employees, primarily driven by the recruitment of qualified engineering professionals to support the six new ASIC design and supply contracts won in the year. Our team continues to deliver some of the most complex semiconductor engineering projects in the industry.
· We opened a new design centre in the Cambridge Science Park focusing on mmWave design which further strengthens our presence in the UK's semiconductor industry and aims to attract top engineering talent, leveraging the vibrant ecosystem of world-class universities and research institutions in Cambridge.
· Two further design centres have been opened to further exploit the highly skilled and experience talent from Campinas in Brazil and Budapest in Hungary. Both locations have a strong semiconductor eco-system allowing us to cost effectively scale our engineering teams.
Outlook
EnSilica continues to make strong operational progress across its key end markets of industrial, automotive, and space.
The Company's chip developments targeting the industrial and automotive sectors are advancing through the design phase as planned. The timing controller ASIC, announced on 5 December 2024, successfully completed the test-chip tape-out in August 2025. A further five tape-outs are scheduled for completion before the end of FY2026, relating to other customer products currently in design, reflecting very strong execution across EnSilica's development pipeline.
The Company continues to see encouraging demand from both existing and new customers in these markets and expects a number of new feasibility and development contracts to be signed before the end of the calendar year.
In the space sector, market activity continues to accelerate, underpinned by increased government and private investment in secure and sovereign satellite broadband capabilities. EnSilica's position in the payload (space segment) domain continues to strengthen following being selected in December 2021 by AST SpaceMobile, Inc. (NASDAQ: ASTS) to develop its next-generation payload ASIC, together with the recent acquisition of SatixFy Communications Ltd. (NYSE: SATX) by MDA Space Ltd. (TSX: MDA). These developments position EnSilica as the key independent European supplier of satellite payload communications ASICs. The Company has secured a number of funded feasibility studies in this payload domain, some of which are expected to progress into full ASIC development programmes during FY2026, further strengthening EnSilica's position within the satellite-payload supply chain.
In parallel, EnSilica continues to advance its activities in the user-terminal (ground segment) domain. Building upon previously announced contracts and funding awards with the European Space Agency (ESA) and the UK Space Agency (UKSA)-announced on 17 February 2023 and 3 February 2025, respectively. These programmes have supported the development of low-power, mass market chipsets addressing next-generation user-terminal products.
EnSilica has now entered into further customer funded engagements covering feasibility studies and chip-evaluation support activities. These engagements are expected to lead to EnSilica chipsets being designed into next-generation user terminals by leading global satellite-service providers.
Future Vision
EnSilica continues to build a strong pipeline and order book, which underpins our ongoing confidence in the business, and entered FY 2026 with strong orders for chip supply and NRE and commercial momentum.
We aim to win two new customer design and supply contracts each year, or more, to ensure sustained growth in chip supply revenues. Our consultancy division remains an integral part of our business model, supporting our path to revenue growth.
The growth and convergence of terrestrial and non-terrestrial markets for space defence in a drive for a resilient communications infrastructure continues to provide the Group with long-term structural growth and our expanded pipeline across key markets leaves the business in a strong position to meet market expectations for FY 2026.
We will continue to invest in our R&D initiatives, such as PQC and satellite communication technology, with continued support from agencies such as the UK Space Agency and Innovate UK.
Despite the disappointing operating loss in FY 2025, the Board remains confident in the Company's ability to return to profitability, citing our success in winning new customers, including six new development and supply agreements and two design agreements with a lifetime value exceeding $100 million, coupled with our ability to control capital expenditure and operational spending.
We are well progressed in our mission of being Europe's premier application specific chip supplier, and our core focus on innovation, quality, and reliability will enable this goal.
Ian Lankshear
Chief Executive Officer
4 November 2025
Finance Review
FY 2025 has been a positive year for the Group with six new ASIC development and supply agreements won by the Group in competitive tendering processes, as well as a 97% increase in supply revenues taking those revenues up to £5.7 million.
The Group's revenues for FY 2025 were £18.2 million, lower than the previous year as a result of the non-recurrence of a large space communication tape-out which occurred in FY 25 as well as lower ASIC development revenues.
Contract wins during FY 2025 included a second industrial automation ASIC design and supply contract secured with Siemens, a timing control ASIC design and supply contract secured with a lifetime project value expected to exceed $30 million, a Photonics Controller ASIC design and supply contract secured with Oriole Networks, an automotive and industrial controller ASIC design and supply contract secured with a lifetime value in excess of $31 million over a seven-year period, a telecommunications ASIC design and supply contract secured with SIAE Microelettronica worth in excess of $30 million over a ten-year period and an $18 million design and supply automotive and industrial contract.
Through new contract wins and growing supply revenues the Group has been able to demonstrate this year that it is continuing to successfully execute on its stated aim of becoming the European 'fabless' semi-conductor company of choice for the development and supply of ASICs in satellite communications, industrial and automotive applications. As a result of the lower total revenues, but helped by the requirement to include the RDEC tax credit of £1.3 million within Other Income, Gross Profit and EBITDA have been lower at £7.3 million and £nil million respectively.
The Group generated £0.9 million of cash from operations, which was supported by an equity raise of £1.2 million and new funds from the refinancing of its existing loans of £1.0 million. The Group also received £1.2 million from HMRC as a research and development tax credit (RDEC). Cash consumption for the full year was £5.3 million, with consumption slowing to £0.2 million in H1 FY 25. In conjunction with its customers, the Group continues to co-invest in the development of customer ASICs as well as its own IP and know-how.
As such, the Group has invested a further £5.8 million in ASIC design and supply contracts and IP assets with the expectation of achieving future supply or royalty revenues as a result of this investment. During FY 2025, £5.7 million of revenues from chip supply and royalties were achieved with further future growth expected from existing chips in supply as well as contracted chips in development.
Financial Results
| |
FY 2025 £'m |
FY 2024 £'m |
| Revenue |
18.2 |
25.3 |
| Cost of goods |
(10.9) |
(16.3) |
| Gross profit |
7.3 |
9.0 |
| Gross margin |
40% |
36% |
| Other income |
1.6 |
- |
| Expected credit loss allowance |
(1.8) |
- |
| Operating expenses |
(7.1) |
(7.3) |
| EBITDA |
- |
1.7 |
| Depreciation & amortisation |
(1.7) |
(0.8) |
| Impairment of assets |
(0.9) |
- |
| Operating (loss)/profit |
(2.6) |
0.9 |
| Interest |
(0.9) |
(0.9) |
| Loss before tax |
(3.5) |
(0.1) |
| Tax |
- |
(0.1) |
| (Loss)/profit for the year |
(2.7) |
(0.2) |
Revenues
The Group's revenues for FY 2025 were £18.2 million.
Revenues from the six new ASIC development and supply agreements only started taking off in the second half of the year and were unable to replace revenues from existing ASIC development and supply agreements moving towards completion of the development phase in H1 FY 2025.
The Company signed six new ASIC development and supply agreements in FY 2025 and the almost doubling of chip supply revenues has ensured that the Group has made significant progress towards its vision of becoming a profitable 'fabless' semiconductor business.
The Group will continue to target entering into three to four new customer design and supply contracts each year in order to ensure continued growth of chip supply revenues in future years. The Company's consultancy division remains an integral part of the business model, with the business relying on this income stream to achieve profitability.
Chip supply revenue evolution
The Group was pleased to announce that chip supply revenue in the period grew by 97% to £5.7 million with further growth expected in FY 2026 and beyond as new chip revenues from existing ASIC development and supply agreements come onstream. With the Siemens industrial controller chip supply now commenced, the Company now has four ASICs which have been released for supply with this chip contributing significantly to chip supply revenues from FY2026 onwards.
Gross Margin
Gross margins in FY 2025 have increased by 4% from 36% to 40% due to a large low margin tape-out in FY 2024 not recurring in FY 2025 which led to margins moving towards their long term expected level of 40%. Margins are expected to increase again in FY 2026 with the higher utilisation of employees on the six new ASIC design and supply contracts signed in FY 2025.
Other Income
Other income includes income received from government grants as well as the RDEC tax credit of £1.3 million.
Expected credit loss allowance
The expected credit loss allowance of £1.8 million consisted almost entirely of the allowance for credit losses raised against the outstanding SIAE customer receivable assessed to be at risk of non payment.
Operating Expenses
Operating expenses were 3% lower, decreasing from £7.3 million in FY 2024 to £7.1 million in FY 2025 due to operational cost savings made alongside the investment in engineering staff required to develop customer ASICs.
EBITDA
As a result of the lower level of revenues, not fully offset by the increase in other income, a corresponding decrease in cost of goods and operating expenses, as well as the expected credit loss expense incurred, EBITDA decreased by £1.7 million from a profit of £1.7 million in FY 2024 to £nil million in FY 2025.
Profit after tax
Interest expense remained stable at £0.9 million whilst taxation increased to a credit of £0.8 million due to deferred tax credits as a result of tax losses incurred, as well as the requirement to include the RDEC tax credit under Other income.
The net impact of the above is a loss after tax of £2.7 million, £2.5 million lower than the prior year.
Headcount
| |
31 May 2025 FTE |
31 May 2024 FTE |
31 May 2023 FTE |
|
|
|
|
|
| Administration |
17 |
16 |
17 |
| Sales & Marketing |
6 |
6 |
6 |
| Research, Development & Technical |
157 |
146 |
145 |
| Average number of employees |
179 |
168 |
168 |
Average Group headcount increased by 11 heads, mainly as a result of the recruitment of qualified engineering staff to support the six new ASIC design and supply contracts won in FY 2025.
Balance sheet
A summary of the balance sheet is set out in the table below:
| |
31 May 2025 £'m |
31 May 2024 £'m |
|
|
|
|
| Cash & Equivalents |
2.0 |
5.2 |
| Intangible Assets |
22.8 |
18.6 |
| Fixed Assets |
3.4 |
3.0 |
| Trade & other receivables |
10.1 |
8.4 |
| Trade & other payables |
(10.5) |
(7.1) |
| Lease liabilities |
(2.7) |
(2.1) |
| Loans |
(5.3) |
(4.0) |
The most notable items on the balance sheet as at 31 May 2025 are:
· Cash and cash equivalents have decreased from £5.2 million to £2.0 million as a result of the movements as described in the cash flow section below.
· Fixed assets have increased mainly as a result of an investment in leased equipment required to meet our disaster recovery obligations and capitalised under IFRS16, offset by depreciation charge incurred of £0.5 million.
· Intangible assets have increased from £18.6 million to £22.8 million at the end of FY 2025 mainly as a result of additions of £5.8 million as the Group continues to co-invest in the development of customer ASICs as well as its own IP and know-how, offset by amortisation of £0.9 million and an impairment of £0.6 million.
· Lease liabilities have increased as a result of entering into a lease for equipment required to meet our disaster recovery obligations, offset by capital repayments made during the year.
· Existing bank loans of £4.0 million at 31 May 2024 were refinanced in November 2024 by way of a Term Loan for £3.0 million and a Revolving Credit Facility Revolving Credit Facility (RCF) of £3.0 million. The loan liability balance of £5.3 million is disclosed net of unamortised loan issue costs and monthly capital repayments at 31 May 2025.
Cash flow
A year of two halves:
| Although the first half of the year was very cash consumptive with Cash outflows from operations and Cash consumption being £1.6 million and £5.1 million respectively, the second half of the year was cash generative from an operational cashflow perspective with £3.7 million being generated and cash consumption decreasing to only £0.2 million.
|
|
| |
FY2025 £'m |
FY 2024 £'m |
| EBITDA |
- |
1.7 |
| Working capital |
0.9 |
0.7 |
| Tax received |
1.2 |
1.8 |
| Net cash flow from operations |
2.1 |
4.3 |
| Investment in intangibles |
(5.8) |
(6.4) |
| Capital expenditure |
(0.7) |
(0.9) |
| Interest paid |
(0.9) |
(0.9) |
| Cash consumption |
(5.3) |
(4.0) |
| Loans received |
5.7 |
0.7 |
| Share issues |
1.2 |
6.5 |
| Loan and lease payments |
(4.7) |
(1.0) |
| Movement in the year |
(3.1) |
2.1 |
The Company generated an EBITDA of £nil million and after positive working capital movements driven by customer contractual upfront receipts and an R&D tax receipt of £1.2 million, generated net cash flow from operations of £2.1 million. £5.8 million was co-invested by the Company in the development of customer ASICs, as well as its own IP and know-how. The Company incurred capital expenditure of £0.7 million on IT equipment. Interest paid on loans and leasehold property liabilities amounted to £0.9 million, as lower interest on the Bank of Scotland loan did not quite offset one-off refinancing interest charges. Cash consumption was £5.3 million, a £1.3 million increase on the prior year.
Loans received on the refinancing with Bank of Scotland Group of £5.7 million was offset by loans and lease liabilities repaid during the year of £4.7 million, leading to net proceeds of £1.0 million. Equity of £1.2 million was raised as part of the equity fundraise in May 2024.
The above movements resulted in a negative movement in the year of £3.1 million (£2.1 million positive in FY 2024).
Financial Outlook
The Group expects FY 2026 revenues of approximately £28 million to £30 million with revenues for the year being second-half weighted.
The Group currently has good visibility of FY 2026 revenues with approximately 80% of revenues being from contracted customers or contracts in negotiation, and the remainder to be earned from new contract wins with identified customers.
EnSilica also expects to achieve an EBITDA of between £3.5 million and £4.5 million in FY 2026. Gross margins are expected to improve alongside increased revenues with margins of approximately 40% expected. Limited increases in operating expenses are expected, mainly inflationary growth but with some limited strategic and small investments.
Kristoff Rademan
CFO
EnSilica plc
4 November
Financial Statements
Consolidated Statement of Comprehensive Income
for the year ended 31 May 2025
| |
|
|
|
Twelve months ended 31 May 2025 |
Twelve months ended 31 May 2024 |
| |
|
|
|
Audited |
Audited |
| |
Note |
|
|
£'000 |
£'000 |
| Revenue |
2 |
|
|
18,183 |
25,266 |
| Cost of sales |
|
|
|
(10,850) |
(16,267) |
| Gross profit |
|
|
|
7,333 |
8,999 |
| Other operating income |
|
|
|
1,623 |
38 |
| Impairment of assets |
6,7 |
|
|
(910) |
- |
| Expected credit loss allowance |
|
|
|
(1,783) |
- |
| Administrative expenses |
|
|
|
(8,893) |
(8,165) |
|
Operating (loss)/ profit |
|
|
|
(2,630) |
872 |
| |
|
|
|
|
|
| Interest income |
|
|
|
- |
1 |
| Interest expense |
|
|
|
(907) |
(925) |
|
Loss before taxation
|
|
|
|
(3,537) |
(52) |
| Taxation |
4 |
|
|
811 |
(130) |
| |
|
|
|
|
|
| Loss for the period |
|
|
|
(2,726) |
(182) |
| |
|
|
|
|
|
|
|
|
|
|
|
|
| Other comprehensive (expense)/ income for the period |
|
|
|
|
|
| Currency translation differences |
|
|
|
49 |
(68) |
| |
|
|
|
|
|
| Total comprehensive loss for the period |
|
|
|
(2,677) |
(250) |
|
|
|
|
|
|
|
| Loss for the period attributable to: |
|
|
|
|
|
| Owners of the company |
|
|
|
(2,726) |
(182) |
| Non-controlling interests |
|
|
|
- |
- |
|
|
|
|
|
(2,726) |
(182) |
|
|
|
|
|
|
|
| Other comprehensive income/(expense for the period attributable to: |
|
|
|
|
|
| Owners of the company |
|
|
|
49 |
(68) |
| Non-controlling interests |
|
|
|
- |
- |
|
|
|
|
|
49 |
(68) |
| Total comprehensive expense for the period attributable to: |
|
|
|
|
|
| Owners of the company |
|
|
|
(2,677) |
(250) |
| Non-controlling interests |
|
|
|
- |
- |
| |
|
|
|
(2,677) |
(250) |
Financial Statements
Earnings per Share Attributable to the Owners of the Parent During the Period (expressed in pence per share)
| |
|
|
|
|
|
| |
|
|
|
Twelve months ended 31 May 2025 |
Twelve months ended 31 May 2024 |
|
|
|
|
|
Audited |
Audited |
| |
Note |
|
|
pence |
pence |
|
|
|
|
|
|
|
| Basic earnings per share (pence) |
5 |
|
|
(3.26) |
(0.23) |
| Diluted earnings per share (pence) |
5 |
|
|
(3.26) |
(0.23) |
Financial Statements
Consolidated Statement of Financial Position
As at 31 May 2025
| |
|
|
|
|
|
|
| |
|
|
|
31 May 2025 Audited |
31 May 2024 Audited |
|
| |
Note |
|
|
£'000 |
£'000 |
|
| Assets |
|
|
|
|
|
|
| Non-current assets |
|
|
|
|
|
|
| Property, plant and equipment |
6 |
|
|
3,373 |
2,997 |
|
| Intangible assets |
7 |
|
|
22,828 |
18,565 |
|
| Total non-current assets |
|
|
|
26,201 |
21,562 |
|
|
|
|
|
|
|
|
|
| Current assets |
|
|
|
|
|
|
| Inventories |
|
|
|
439 |
753 |
|
| Trade and other receivables |
8 |
|
|
10,107 |
8,390 |
|
| Corporation tax recoverable |
|
|
|
1,363 |
1,349 |
|
| Cash and cash equivalents |
|
|
|
1,963 |
5,156 |
|
| Total current assets |
|
|
|
13,872 |
15,648 |
|
|
Total assets |
|
|
|
40,073 |
37,210 |
|
|
|
|
|
|
|
|
|
| Current liabilities |
|
|
|
|
|
|
| Borrowings |
9 |
|
|
(3,862) |
(1,717) |
|
| Lease liabilities |
|
|
|
(571) |
(199) |
|
| Trade and other payables |
10 |
|
|
(10,492) |
(7,118) |
|
| Total current liabilities |
|
|
|
(14,925) |
(9,034) |
|
|
|
|
|
|
|
|
|
| Non current liabilities |
|
|
|
|
|
|
| Borrowings |
9 |
|
|
(1,422) |
(2,298) |
|
| Lease liabilities |
|
|
|
(2,126) |
(1,904) |
|
| Provisions |
|
|
|
(235) |
(206) |
|
| Deferred tax |
|
|
|
(466) |
(1,365) |
|
| Total non current liabilities |
|
|
|
(4,248) |
(5,773) |
|
|
|
|
|
|
|
|
|
| Total liabilities |
|
|
|
(19,174) |
(14,807) |
|
|
|
|
|
|
|
|
|
| Net assets |
|
|
|
20,900 |
22,403 |
|
|
|
|
|
|
|
|
|
| Equity |
|
|
|
|
|
|
| Issued share capital |
11 |
|
|
156 |
153 |
|
| Share premium account |
|
|
|
16,181 |
14,957 |
|
| Currency differences reserve |
|
|
|
(107) |
(117) |
|
| Retained earnings |
|
|
|
4,670 |
7,410 |
|
| Equity attributable to owners of the Company |
|
|
|
20,900 |
22,403 |
|
| Non-controlling interests |
|
|
- |
- |
- |
|
| Total equity |
|
|
|
20,900 |
22,403 |
|
| |
|
|
|
|
|
|
The notes are an integral part of these condensed financial statements.
| Ian Lankshear |
Kristoff Rademan |
| CEO |
CFO |
| EnSilica plc |
EnSilica plc |
Financial Statements
Condensed Consolidated Statement of Changes in Equity
|
|
Share Capital |
Share premium account |
Currency translation reserve |
Retained earnings |
|
|
Total equity |
||||||
|
|
£'000 |
£'000 |
£'000 |
£'000 |
|
|
£'000 |
||||||
| At 1 June 2023 |
137 |
8,752 |
(49) |
7,123 |
|
|
15,963 |
||||||
| Profit for the period |
- |
- |
- |
515 |
|
|
515 |
||||||
| Other comprehensive expense |
- |
- |
(78) |
- |
|
|
(78) |
||||||
| Total comprehensive (expense)/income for the period |
- |
- |
(78) |
515 |
|
|
437 |
||||||
| Share based payment |
- |
- |
- |
114 |
|
|
114 |
||||||
| At 30 November 2023 |
137 |
8,752 |
(126) |
7,752 |
|
|
16,515 |
||||||
| |
|
|
|
|
|
|
|
|
|
|
|
|
|
| |
|
|
|
|
|
|
|
|
|
|
|
|
|
|
|
Share Capital |
Share premium account |
Currency translation reserve |
Retained earnings |
|
|
Total equity |
||||||
|
|
£'000 |
£'000 |
£'000 |
£'000 |
|
|
£'000 |
||||||
| At 1 Dec 2023 |
137 |
8,752 |
(126) |
7,752 |
|
|
16,515 |
||||||
| Loss for the period |
- |
- |
- |
(696) |
|
|
(696) |
||||||
| Other comprehensive expense |
- |
- |
9 |
- |
|
|
9 |
||||||
| Total comprehensive (expense)/income for the period |
- |
- |
9 |
(696) |
|
|
(687) |
||||||
| Share based payment |
- |
(217) |
- |
354 |
|
|
137 |
||||||
| Issue of share capital |
16 |
6,893 |
- |
- |
|
|
6,909 |
||||||
| Cost of share issue |
- |
(471) |
- |
- |
|
|
(471) |
||||||
| At 31 May 2024 |
153 |
14,957 |
(117) |
7,410 |
|
|
22,403 |
||||||
| |
|
|
|
|
|
|
|
|
|
|
|
|
|
| |
|
|
|
|
|
|
|
|
|
|
|
|
|
| Loss for the period |
- |
- |
- |
(2,725) |
|
- |
(2,725) |
| Other comprehensive expense |
- |
- |
10 |
(275) |
|
- |
(265) |
| Total comprehensive expense for the period |
- |
- |
10 |
(3,000) |
|
- |
(2,990) |
| Share based payment |
- |
- |
- |
260 |
|
- |
260 |
| Issue of share capital |
3 |
1,408 |
- |
- |
|
- |
1,411 |
| Cost of share issue |
- |
(184) |
- |
- |
|
- |
(184) |
| At 31 May 2025 |
156 |
16,181 |
(107) |
4,670 |
|
- |
20,900 |
Financial Statements
Consolidated Statement of Cash Flows
for the year ended 31 May 2025
|
|
Note |
|
|
Twelve months ended 31 May 2025 Audited |
Twelve months ended 31 May 2024 Audited |
|
|
|
|
|
£'000 |
£'000 |
| Cash flows from operating activities |
|
|
|
|
|
| Cash generated from operations |
A |
|
|
933 |
2,482 |
| Tax received |
|
|
|
1,177 |
1,788 |
| Net cash generated from operating activities |
|
|
|
2,110 |
4,270 |
|
|
|
|
|
|
|
| Cash flows from investing activities |
|
|
|
|
|
| Purchase of property, plant and equipment |
|
|
|
(681) |
(927) |
| Additions to intangible assets |
|
|
|
(5,797) |
(6,425) |
| Interest received |
|
|
|
- |
1 |
| Net cash used in investing activities |
|
|
|
(6,478) |
(7,351) |
|
|
|
|
|
|
|
| Cash flows from financing activities |
|
|
|
|
|
| Proceeds from issuance of ordinary shares |
|
|
|
1,228 |
6,480 |
| Interest paid |
|
|
|
(908) |
(925) |
| Lease liability payments |
|
|
|
(309) |
(172) |
| Loans and borrowings received |
|
|
|
5,710 |
713 |
| Loans and borrowing repaid |
|
|
|
(4,436) |
(865) |
| Net cash generated from financing activities |
|
|
|
1,285 |
5,231 |
|
|
|
|
|
|
|
| Net (decrease)/increase in cash and cash equivalents |
|
|
|
(3,083) |
2,150 |
| Cash and cash equivalents at beginning of year |
|
|
|
5,156 |
3,095 |
| Foreign exchange losses |
|
|
|
(110) |
(89) |
| Cash and cash equivalents at end of period |
B |
|
|
1,963 |
5,156 |
Financial Statements
Notes to the Consolidated Statement of Cash Flows
for the year ended 31 May 2025
A. Cash generated from operations
The reconciliation of profit for the year to cash generated from operations is set out below:
|
|
|
|
Twelve months ended 31 May 2025 |
Twelve months ended 31 May 2024 |
||||
|
|
|
|
£'000 |
£'000 |
||||
| Loss for the year |
|
|
(2,726) |
(182) |
||||
| Adjustments for: |
|
|
|
|
||||
| Depreciation |
|
|
633 |
495 |
||||
| Amortisation of intangible assets |
|
|
1,038 |
322 |
||||
| Impairment of assets |
|
|
910 |
- |
||||
| Share based payments |
|
|
261 |
248 |
||||
| Net interest costs |
|
|
908 |
924 |
||||
| Research and development expenditure credit (Other income) |
|
|
(1,278) |
- |
||||
| Tax (credit)/charge |
|
|
(811) |
130 |
||||
|
|
|
|
(1,065) |
1,937 |
||||
|
Changes in working capital |
|
|
|
|
||||
| Decrease/ (increase) in inventories |
|
|
313 |
(448) |
||||
| Increase in trade and other receivables |
|
|
(1,718) |
(997) |
||||
| Increase in trade and other payables |
|
|
3,373 |
1,983 |
||||
| Increase in provisions |
|
|
29 |
7 |
||||
| Cash (used in) /generated from operations |
|
|
933 |
2,482 |
||||
| |
|
|
|
|
|
|
|
|
| |
|
|
|
|
|
|
|
|
B. Analysis of net debt
|
|
At 1 June 2023 |
Cash flow |
Non-cash changes |
At 31 May 2024 |
|
|
|
£'000 |
£'000 |
£'000 |
£'000 |
|
| Loans |
(4,167) |
152 |
- |
(4,015) |
|
| Lease liabilities |
(2,275) |
172 |
- |
(2,103) |
|
| Liabilities arising from financing activities |
(6,442) |
324 |
- |
(6,118) |
|
| Cash and cash equivalents |
3,095 |
2,150 |
(89) |
5,156 |
|
| Net debt |
(3,347) |
2,474 |
(89) |
(962) |
|
|
|
At 1 June 2024 |
Cash flow |
Non-cash changes |
At 31 May 2025 |
|
|
£'000 |
£'000 |
£'000 |
£'000 |
| Loans |
(4,015) |
(1,274) |
5 |
(5,284) |
| Lease liabilities |
(2,103) |
309 |
(902) |
(2,696) |
| Liabilities arising from financing activities |
(6,118) |
(965) |
(897) |
(7,980) |
| Cash and cash equivalents |
5,156 |
(3,083) |
(110) |
1,963 |
| Net debt |
(962) |
(4,048) |
(1,007 |
(6,017) |
Financial Statements
Notes to the Condensed Consolidated Financial Statements
For the Year ended 31 May 2025
1. General information
EnSilica plc is a public limited company incorporated in the United Kingdom, listed on the Alternative Investment Market (AIM) of the London Stock Exchange. The Company is domiciled in the United Kingdom, and its registered office is 100 Park Drive, Milton Park, Abingdon, OX14 4RY. The consolidated financial statements comprise the Company and its subsidiaries (together referred to as the 'Group'). The Company is a leading fabless design house focused on custom ASIC design and supply for OEMs and system houses, as well as IC design services for companies with their own design teams. The Company has world-class expertise in supplying custom RF, mmWave, mixed signal and digital ICs to its international customers in the automotive, industrial, healthcare and communications markets. The Company also offers a broad portfolio of core IP covering cryptography, radar and communications systems. EnSilica has a track record in delivering high quality solutions to demanding industry standards. The Company is headquartered near Oxford, UK and has design centres across the UK, India, Brazil and a sales office in Germany
Basis of preparation
The consolidated financial statements of the Company have been prepared in accordance with UK-adopted International Accounting Standards (IFRS) as issued by the International Accounting Standards Board (IASB) and the Companies Act 2006.
The financial information has been prepared under the historical cost convention unless otherwise specified within these accounting policies. The financial information and the notes to the financial information are presented in thousands of pounds sterling (£'000), the functional and presentation currency of the Group, except where otherwise indicated.
The principal accounting policies adopted in preparation of the financial information are set out below. The policies have been consistently applied to all periods presented, unless otherwise stated.
Judgements made by the Directors in the application of the accounting policies that have a significant effect on the financial information and estimates with significant risk of material adjustment in the next year are discussed below.
Going concern
For the year ending 31 May 2025, the Group generated revenues of £18.2 million and an operating loss of £2.6 million; and generated cash flow from operations of £2.1 million. As at 31 May 2025 the Group held cash balances of £2.0 million and the Group's financing arrangements consisted of a loan of £5.3 million from Bank of Scotland.
In considering the basis of preparation of the financial statements, the Directors have prepared a cash flow forecast for a period of at least 12 months from the date of approval of these financial statements based on the 2026 Board approved budget and forecasts for the financial year 2027. The Directors have undertaken a rigorous assessment of the 2026 budget and 2027 forecast and assessed identified downside risks and mitigating actions. The assumptions around project sales, staffing and purchases are based on management's expectations over the forecast period.
Under both the base case and mitigated downside scenario, the Company have sufficient cash resources to continue in operation for a period of at least 12 months from the date of approval of these financial statements. In the event of the downside scenario crystallising, with resulting delays to key revenue generating project milestones or new contracts not being secured in time, the Company could be at risk of breaching its financial loan covenants if an accommodation with Bank of Scotland could not be reached. Whilst the Company maintains a very good relationship with Bank of Scotland and is confident of securing its support, if the Company is unable to secure a waiver or amendment to its financial covenants, this would cause the outstanding loan to become immediately repayable which would give rise to a material uncertainty, as defined in auditing and accounting standards, related to events or conditions that may cast significant doubt on the entity's ability to continue as a going concern and in such circumstances it may therefore be unable to realise its assets and discharge its liabilities in the normal course of business.
Taking account of the matters described above, the Board has confidence in the Company's ability to continue as a going concern for the following reasons:
‣ the Company's ability to continue to be successful in winning new customers and building its brand as demonstrated by the signing of 6 new development and supply agreements and two design agreement in the last 12 months with a lifetime value greater than $100 million,
‣ the Company's history of being able to access capital markets as evidenced by the raising of £5.2 million gross equity in May 2024 and,
‣ the Company's customer contracted order book with more than 80% of revenues for the forecast period being contracted and,
‣ the Company's ability to control capital expenditure and lower other operational spend, as necessary
Taking account of the matters described above, the Directors are confident that the Company will have sufficient funds to continue to meet their liabilities as they fall due for at least 12 months from the date of approval of the financial statements and therefore have prepared the financial statements on a going concern basis.
Accounting policies
Basis of consolidation
The consolidated financial statements comprise the financial statements of the Company and its subsidiaries as at 31 May 2025. Control is achieved when the Group is exposed, or has rights, to variable returns from its involvement with the investee and has the ability to affect those returns through its power over the investee. Specifically, the Group controls an investee if, and only if, the Group has:
‣ Power over the investee (i.e. existing rights that give it the current ability to direct the relevant activities of the investee)
‣ Exposure, or rights, to variable returns from its involvement with the investee
‣ The ability to use its power over the investee to affect its returns generally, there is a presumption that a majority of voting rights results in control. To support this presumption and when the Group has less than a majority of the voting or similar rights of an investee, the Group considers all relevant facts and circumstances in assessing whether it has power over an investee,
including:
‣ The contractual arrangement(s) with the other vote holders of the investee
‣ Rights arising from other contractual arrangements
‣ The Group's voting rights and potential voting rights. The Group re-assesses whether or not it controls an investee if facts and circumstances indicate that there are changes to one or more of the three elements of control.
Consolidation of a subsidiary begins when the Group obtains control over the subsidiary and ceases when the Group loses control of the subsidiary. Assets, liabilities, income and expenses of a subsidiary acquired or disposed of during the year are included in the consolidated financial statements from the date the Group gains control until the date the Group ceases to control the subsidiary. Profit or loss and each component of OCI are attributed to the equity holders of the parent of the Group and to the noncontrolling interests, even if this results in the non-controlling interests having a deficit balance. When necessary, adjustments are made to the financial statements of subsidiaries to bring their accounting policies in line with the Group's accounting policies. All intra-group assets and liabilities, equity, income, expenses and cash flows relating to transactions between members of the Group are eliminated in full on consolidation. A change in the ownership interest of a subsidiary, without a loss of control, is accounted for as an equity transaction. If the Group loses control over a subsidiary, it derecognises the related assets (including goodwill), liabilities, non-controlling interest and other components of equity, while any resultant gain or loss is recognised in profit or loss. Any investment retained is recognised at fair value.
Critical accounting estimates and judgements
The preparation of the financial information under IFRS requires the use of certain critical accounting assumptions and requires management to exercise its judgement and to make estimates in the process of applying the Company's accounting policies.
Management bases its estimates on historical experience and on various other assumptions that management believes to be reasonable in the circumstances. The key estimates and judgements used in the preparation of this financial information that could result in a material change in the carrying value of assets or liabilities within the next twelve months are as follows:
Intangible assets - capitalisation, impairment and amortisation of development expenditure
Judgement
The capitalisation of development costs is subject to a degree of judgement in respect of the timing when the commercial viability of new technology and know-how is reached, supported by the results of testing and customer trials, and by forecasts for the overall value and timing of sales which may be impacted by other future factors which could impact the assumptions made. In making their judgements, the Directors considered the carrying values of the intangible assets that are disclosed in note 7.
Estimation
Amortisation commences once management consider that the asset is available for use, i.e. when it is judged to be in the location and condition necessary for it to be capable of operating in the manner intended by management and the cost is amortised over the estimated useful life of the asset based on experience of and future expected customer product cycles and lives. The useful economic lives and residual values are re-assessed annually. They are amended when necessary to reflect current estimates, based on technological advancement, future investments and economic utilisation.
Impairment of non-financial assets
Impairment exists when the carrying value of an asset or cash generating unit exceeds its recoverable amount, which is the higher of its fair value less costs of disposal and its value in use. The fair value less costs of disposal calculation is based on available data from binding sales transactions, conducted at arm's length, for similar assets or observable market prices less incremental costs of disposing of the asset. The value in use calculation is based on a DCF model. The cash flows are derived from the budget for the next five years and do not include restructuring activities that the Group is not yet committed to or significant future investments that will enhance the performance of the assets of the CGU being tested. The recoverable amount is sensitive to the discount rate used for the DCF model as well as the expected future cash-inflows and the growth rate used for extrapolation purposes.
These estimates are most relevant to goodwill and other intangibles with indefinite useful lives recognised by the Group. The key assumptions used to determine the recoverable amount for the different CGUs, including a sensitivity analysis, are disclosed and further explained in Note 7.
Revenue
Estimation
In accordance with the policy on revenue recognition, management are required to judge the percentage of completion of the contract in order to recognise revenues. The overall recognition of revenue will depend upon the nature of the project and whether it is billed on a time and materials basis, or, on a project milestone basis where invoices can only be raised on completion of specific, pre-agreed objectives.
The Company maintains complete and accurate records of employees' time and expenditure on each project which is regularly assessed to determine the percentage completion, and thereby whether it is appropriate to recognise revenues.
As it satisfies its performance obligations, the Company recognises revenue and the related contract asset with regards to the customer development contracts. Revenues are recognised on a percentage of completion basis and as such require estimation in terms of the assessment of the correct percentage of completion for that specific contract.
Management judgement is based on a strong track record of successful completion of projects and accurate forecasting of the time required together with the hindsight period available to support the balance sheet date assumptions made.
2. Segmental analysis
The Board continues to define all the Group's trading as operating in the integrated circuit design market and considers all revenue to relate to the same, one operating segment.
Disaggregation of revenue
Revenue in respect of the supply of products is recognised at a point in time. Design and related services, including income for the use of IP, are recognised over the period when services are provided.
|
|
|
Twelve months ended 31 May 2025 |
Twelve months ended 31 May 2024 |
|
|
|
£'000 |
£'000 |
| Recognised at a point in time |
|
|
|
|
Supply of products |
|
5,741 |
2,926 |
| Recognised over time |
|
|
|
| NRE design services |
|
5,891 |
15,228 |
| Consultancy design services |
|
6,551 |
7,112 |
| |
|
|
|
| |
|
12,442 |
22,340 |
|
|
|
18,183 |
25,266 |
| By destination: |
|
|
|
| UK |
|
4,250 |
2,513 |
| Rest of Europe |
|
10,893 |
9,863 |
| Rest of the World |
|
3,040 |
12,890 |
| Total revenue |
|
18,183 |
25,266 |
The nature of the design services and projects is such that there can be significant customers as a proportion of revenue in any one year but that these may be different customers from year to year. Revenue in 2025 was less dominated by any one customer than in 2024 where one customer contributed £8.8m (35% of revenue). In 2025 the largest contribution made by a single customer was £4.3m, amounting to 24% of revenue, with the next largest contribution being £2.4m (13%).
The Group's non-current assets comprising investments, tangible and intangible fixed assets and the net assets by geographical location are:
| |
|
|
31 May 2025 |
|
31 May 2024 |
|
||||||
|
|
|
|
|
Non-current assets |
Net assets |
Non-current assets |
Net assets |
|||||
|
|
|
|
|
£'000 |
£'000 |
£'000 |
£'000 |
|||||
| |
|
|
|
|
|
|
|
|||||
| United Kingdom |
|
|
|
25,999 |
20,030 |
21,501 |
21,621 |
|||||
| India |
|
|
|
126 |
1,133 |
3 |
1,304 |
|||||
| Brazil |
|
|
|
76 |
36 |
58 |
(27) |
|||||
| Germany |
|
|
|
- |
(299) |
- |
(495) |
|||||
|
|
|
|
|
26,201 |
20,900 |
21,562 |
22,403 |
|||||
|
|
|
|
|
|
|
|
|
|
|
|||
|
|
|
|
|
|
|
|
|
|
|
|
|
|
3. Alternative performance measures
These items are included in normal operating costs of the business but are significant cash and non-cash expenses that are separately disclosed because of their size, nature or incidence. It is the Group's view that excluding them from operating profit gives a better representation of the underlying performance of the business in the year.
The Group's primary results measure, which is considered by the directors of EnSilica plc to better represent the underlying and continuing performance of the Group, is EBITDA as set out below. EBITDA is a commonly used measure in which earnings are stated before net finance income, amortisation and depreciation as a proxy for cash generated from trading.
|
|
|
|
Twelve months ended 31 May 2025 |
Twelve months ended 31 May 2024 |
||
|
|
|
|
£'000 |
£'000 |
|
|
| |
|
|
|
|
|
|
| Operating (loss)/ profit before interest |
|
|
(2,630) |
872 |
|
|
| |
|
|
|
|
|
|
| Depreciation |
|
|
633 |
495 |
|
|
| Amortisation of intangible assets |
|
|
985 |
322 |
|
|
| Other amortisation |
|
|
53 |
|
|
|
| Impairment of assets |
|
|
910 |
|
|
|
| EBITDA |
|
|
(49) |
1,689 |
|
|
|
|
|
|
|
|
|
|
| |
|
|
|
|
|
|
| |
|
|
|
|
|
|
4. Taxation on profit
|
|
|
Twelve months ended 31 May 2025 |
Twelve months ended 31 May 2024 |
|
||
|
|
|
£'000 |
£'000 |
|
||
| Current taxation |
|
|
|
|
||
| UK corporation tax credit |
|
- |
1,258 |
|
||
| Foreign tax charge |
|
(88) |
(183) |
|
||
|
|
|
(88) |
1,075 |
|
||
| Deferred taxation |
|
|
|
|
|
|
| Origination and reversal of timing differences |
|
899 |
(1,205) |
|
||
| Tax credit/(charge) on (loss)/profit |
|
811 |
(130) |
|
||
| |
|
|
|
|
|
|
5. Earnings per share
|
|
|
|
Twelve months ended 31 May 2025 |
Twelve months ended 31 May 2024 |
| Loss used in calculating EPS (£'000) |
|
|
(2,726) |
(182) |
| Number of shares for basic EPS ('000s) |
|
|
83,512 |
80,747 |
| Basic earnings per share (pence) |
|
|
(3.26) |
(0.23) |
| Number of shares for diluted EPS ('000s) |
|
|
83,512 |
80,747 |
| Diluted earnings per share (pence) |
|
|
(3.26) |
(0.23) |
6. Property, plant and equipment
|
|
Right-of-use property |
Leasehold improvements |
Office equipment |
Right-of-use equipment |
Computer equipment |
Total |
|
|||||||||||
| |
£'000 |
£'000 |
£'000 |
£'000 |
£'000 |
£'000 |
|
|||||||||||
| |
|
|
|
|
|
|
|
|||||||||||
| Cost |
|
|
|
|
|
|
||||||||||||
| At 1 June 2024 |
2038 |
240 |
241 |
1,111 |
839 |
|
4,469 |
|
||||||||||
| Additions |
202 |
- |
28 |
696 |
454 |
|
1,380 |
|
||||||||||
| Disposals |
(213) |
- |
- |
(6) |
(360) |
|
(578) |
|
||||||||||
| At 31 May 2025 |
2,027 |
240 |
269 |
1,801 |
933 |
|
5,270 |
|
||||||||||
| |
|
|
|
|
|
|
|
|
||||||||||
| Depreciation |
|
|
|
|
|
|
|
|
||||||||||
| At 1 June 2024 |
(578) |
(42) |
(152) |
(183) |
(517) |
|
(1,472) |
|
||||||||||
| Charge for the year |
(264) |
(24) |
(42) |
(164) |
(175) |
|
(669) |
|
||||||||||
| On disposals |
213 |
-- |
- |
- |
36 |
|
249 |
|
||||||||||
| Exchange adjustments |
- |
- |
(3) |
- |
(3) |
|
(6) |
|
||||||||||
| At 31 May 2025 |
(629) |
(67) |
(198) |
(347) |
(657) |
|
(1,898) |
|
||||||||||
| |
|
|
|
|
|
|
|
|
||||||||||
| Net book value |
|
|
|
|
|
|
|
|
||||||||||
| At 31 May 2025 |
1,398 |
173 |
71 |
1454 |
276 |
|
3,372 |
|
||||||||||
| At 31 May 2024 |
1,460 |
198 |
89 |
928 |
322 |
|
2,997 |
|
||||||||||
| |
|
|
|
|
|
|
|
|
||||||||||
| |
|
|
|
|
|
|
|
|
|
|
|
|
|
|
|
|
|
|
An impairment of £360,000 was recognised related to right of use assets capitalised related to a major US electronics ASIC supply contract, where this ASIC is considered highly unlikely to move forward into manufacturing for chip supply.
7. Intangible assets
| |
|
|
|
Intellectual property |
|
|||||
| |
|
£'000 |
£'000 |
£'000 |
£'000 |
|||||
| Cost |
|
|
|
|
|
|||||
| At 1 June 2024 |
|
21,903 |
123 |
39 |
22,065 |
|||||
| Additions |
|
5,681 |
- |
116 |
5,797 |
|||||
| Impairment |
|
(550) |
- |
- |
(550) |
|||||
| At 31 May 2025 |
|
27,034 |
123 |
155 |
27,312 |
|||||
| |
|
|
|
|
|
|||||
| Amortisation and impairment |
|
|
|
|
|
|||||
| At 1 June 2024 |
|
(3,417) |
(75) |
(7) |
(3,501) |
|||||
| Charge for the year |
|
(955) |
(25) |
(3) |
(985) |
|||||
| At 31 May 2025 |
|
(4,372) |
(100) |
(14) |
(4,486) |
|||||
|
|
|
|
|
|
|
|||||
| Net book value |
|
|
|
|
|
|||||
| At 31 May 2025 |
|
22,662 |
23 |
142 |
22,828 |
|||||
| At 31 May 2024 |
|
18,486 |
48 |
31 |
18,565 |
|||||
| |
|
|
|
|
|
|||||
| |
|
|
|
|
|
|
|
|
|
|
Capitalised development expenditure relates to developed intellectual property in respect of circuit and chip design. The recoverable amount of a cash generating unit (CGU) is assessed using a value in use model across each individual project that forms the intellectual property that has been capitalised. The value in use for each portion is dependent on the expected life cycle of the CGU using a discount factor of 11.50% (2024: 11.5%), being the cost of capital for the CGU.
An impairment of £277,000 was recognised related to intangible assets capitalised related to a Telecommunications ASIC and impairment of £273,000 related to an ASIC to address the e-mobility market where these assets were considered unlikely to move forward into commercialisation.
8. Trade and other receivables
|
|
|
31 May 2025 |
31 May 2024 |
| Current |
|
£'000 |
£'000 |
| Trade receivables |
|
5,868 |
1,743 |
| Other receivables |
|
925 |
1,062 |
| Prepayments |
|
1,613 |
1,306 |
| Contract assets |
|
1,702 |
4,279 |
| Total |
|
10,107 |
8,390 |
9. Borrowings
|
|
|
31 May 2025 |
31 May 2024 |
| Current |
|
£'000 |
£'000 |
| Bank loans |
|
3,862 |
1,717 |
| |
|
|
|
| Non-current |
|
|
|
| Bank loans |
|
1,422 |
2,298 |
|
|
|
|
|
| Total |
|
5,284 |
4,015 |
|
|
31 May 2025 |
31 May 2024 |
| Movement in Loans |
£'000 |
£'000 |
| Opening balance June 1st |
4,015 |
4,167 |
| Loan received |
6,000 |
713 |
| Interest accrued |
543 |
572 |
| Interest paid |
(531) |
(513) |
| Redemption of loans |
(3,567) |
- |
| Capitalisation of issue costs |
(263) |
- |
| Loan repayments |
(913) |
(920) |
| Closing balance |
5,284 |
4,015 |
In November 2024, existing borrowings with carrying value of £3.6 million were redeemed by way of a new Term Loan for £3.0 million, and a Revolving Credit Facility (RCF) of £3.0 million, which was drawn down in 2 tranches. The loan liability is stated net of unamortised loan issue costs of £263000 at 31 May 2025 (2023: £140,000).
The bank loan of £3.0 million is secured by fixed and floating charges over the assets of the group and bears interest at rates of 3.5% over the Bank of England Base Rate. It is repayable in monthly instalments over the period to November 2027.
The revolving credit facility of £3.0 million is secured by fixed and floating charges over the assets of the group and bears interest at the Bank of England Base Rate plus 2.5%.
Previous borrowings, which totalled £3.6 million at redemption attracted interest as follows:
Loan 1: £1.0 million - 8% over SONIA if SONIA exceeds 10%
Loan 2: £1.9 million - 13% fixed rate; and
Loan 3: £0.7 million - 16% fixed rate.
10. Trade and other payables
|
|
|
31 May 2025 |
31 May 2024 |
| Current |
|
£'000 |
£'000 |
| Trade payables |
|
2,745 |
3,496 |
| Taxation and social security |
|
1,092 |
943 |
| Other payables |
|
187 |
170 |
| Accruals |
|
579 |
1,293 |
| Contract liabilities |
|
5,889 |
1,216 |
| Total |
|
10,492 |
7,118 |
11. Share capital
|
|
|
|
|
| Allotted, called up and fully paid |
|
31 May 2025 |
31 May 2024 |
| |
|
£'000 |
£'000 |
| 96,600,636 ordinary shares of £0.001 each |
|
97 |
94 |
| 59,190 deferred shares of £1.00 each |
|
59 |
59 |
|
|
|
156 |
153 |
On 17 June 2024, the Company announced that it had raised gross proceeds of £1.1 million through the issue of 2,465,119 Ordinary Shares at 45p each, and a further £0.3m through the issue of 666,589 shares via a wrap placement.
12. Post balance sheet events
Subsequent to the end of the period under review there have been no events that the company feels should be brought to the shareholders' attention.
13. Related party transactions
During the period under review, the Company undertook transactions with the following related parties:
| |
|
|
Twelve months to 31 May 2025 |
Twelve months to 31 May 2024 |
|
|
|||||
| Name |
Services |
|
|
Transactions during the period |
Balance owing/ (owed) at 31 May 2025 |
Transactions during the year |
Balance owing/ (owed) at 31 May 2024 £'000 |
|
|
|
|
|
|
|
|
|||||||||
| |
|
|
|||||||||
| |
|
|
|||||||||
| |
|
|
|||||||||
| |
|
|
|
|
|
|
|
|
|
|
|
| Ensilica India Private Limited |
Semiconductor design services |
|
|
658 |
(657) |
954 |
(1,045) |
|
|
|
|
| EnSilica Do Brasil Sociedade Unipessoal Limitada |
Semiconductor design services |
|
|
1,357 |
- |
1,151 |
- |
|
|
|
|
| EnSilica GMBH |
Semiconductor sales services |
|
|
257 |
(288) |
207 |
478 |
|
|
|
|
| |
|
|
|
|
|
|
|
|
|
|
|
| |
|
|
|
|
|
|
|
|
|
|
|